Task 04: Add-ins - Create Workbook dashboards to visualize resource usage
Introduction
One of Terra Firm’s requirements is visual monitoring-because dashboards make it easier to spot trouble before users do. Building a Workbook gives Dennis’s team an at-a-glance view of VM health and utilization, supporting day-2 operations as the pilot workload settles into Azure.
Task purpose
Create an operational dashboard that provides quick visibility into the health and utilization of the migrated VM.
Notes
- If Virtual Machine Host namespace metrics aren’t available in your tenant, try Virtual Machine namespace instead.
- Split by may remain disabled if the selected metrics do not expose dimensions. That is expected.
- Your charts should reflect CPU and Network In/Out (not memory).
-
In the Azure portal, search for and then select Monitor.
-
On the left menu, select Workbooks.
-
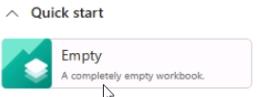
Under Quick start, select Empty to create a new workbook.
-
In the new workbook, select + Add > Add metric.
-
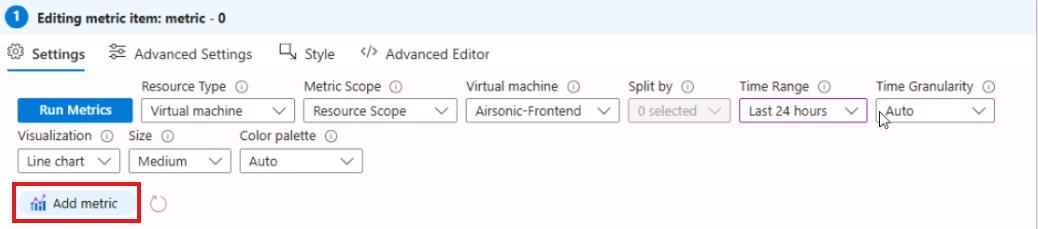
In the Editing metric page, select the following:
Object Value Resource Type Virtual machine Metric Scope Resource Scope Virtual machine Load all subscriptions
Airsonic-FrontendTime Range Last 24 Hours -
Select Add Metric.
-
Add the following:
Object Value Namespace Virtual Machine Host Metric Percentage CPU Aggregation Average Display Name CPU 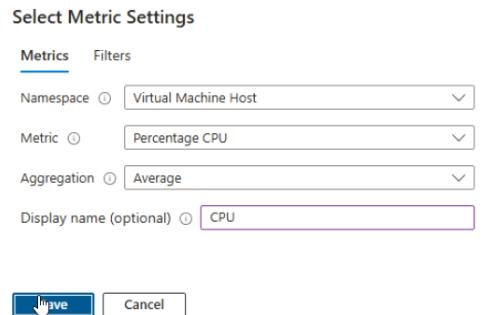
-
Select Save.
-
Select Add Metric.
-
Add the following:
Object Value Namespace Virtual Machine Host Metric Network In Total Aggregation Sum Display Name Network In -
Select Save.
-
Select Add Metric.
-
Add the following:
Object Value Namespace Virtual Machine Host Metric Network Out Total Aggregation Sum Display Name Network Out -
Once you have added all three metrics, select Save

-
In the Save As flyout, enter the following:
Object Value Title Airsonic-VM-Monitor-@lab.LabInstance.Id Resource Group AZMigrateRG Location @lab.CloudResourceGroup(AZMigrateRG).Location -
Select Save As.
-
Observe the resource chart that was created, showing CPU, memory in, and memory out.
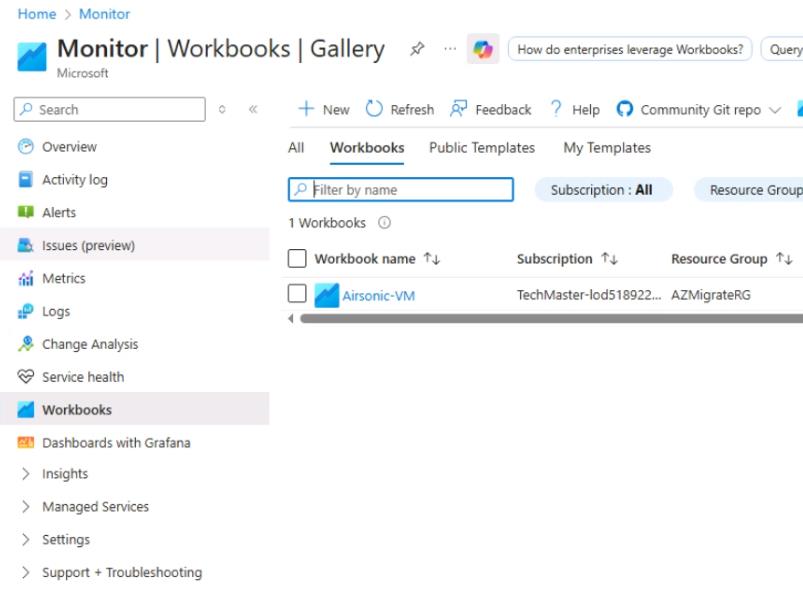
You can retrieve this chart in the future by going to Monitor in the portal, selecting Workbooks, and then selecting the workbook that you saved.
Congratulations!
You created and saved a Monitor Workbook that charts CPU and network traffic for the Airsonic-Frontend VM over the last 24 hours, providing a reusable dashboard for ongoing operations.