Task 02: Explore the data in the Azure Databricks environment with Unity Catalog
Introduction
In Task 1, you saw how Zava uses DLT pipelines to create a Medallion architecture for their data. Now let’s look at how Zava manages data governance by using Unity Catalog.
Key steps
-
In the left pane, select Catalog.
-
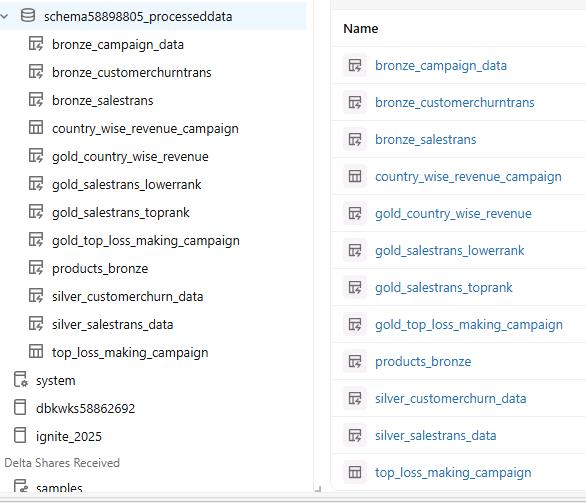
In the list of catalogs, expand dbkwks@lab.LabInstance.Id. Then, expand schema@lab.LabInstance.Id_processeddata.
-
Verify that there are tables created by the pipeline are listed. Refresh the page if you don’t see the tables.
-
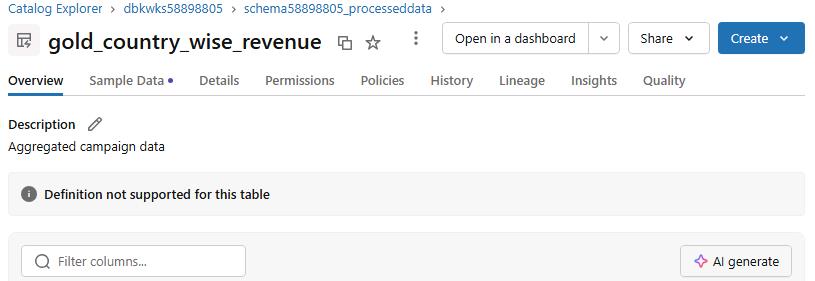
Select gold_country_wise_revenue.
-
On the command bar for the table, select Lineage.

-
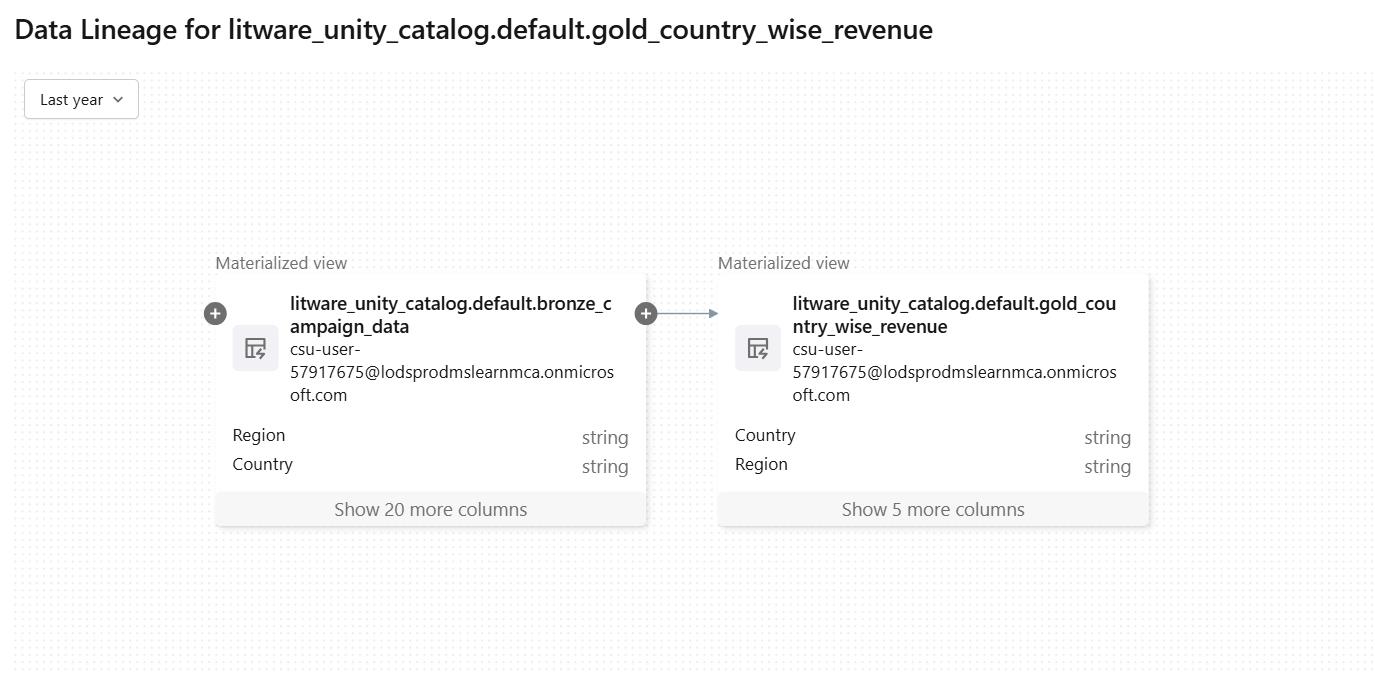
Select See lineage graph to view the full upstream and downstream data flow.

View the visualization that shows how the Gold table is derived from upstream Bronze and Silver tables.
-
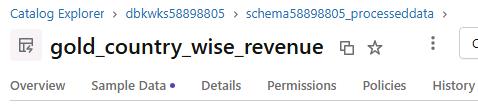
Close the lineage graph page. Then, on the command bar for the table, select Overview.
-
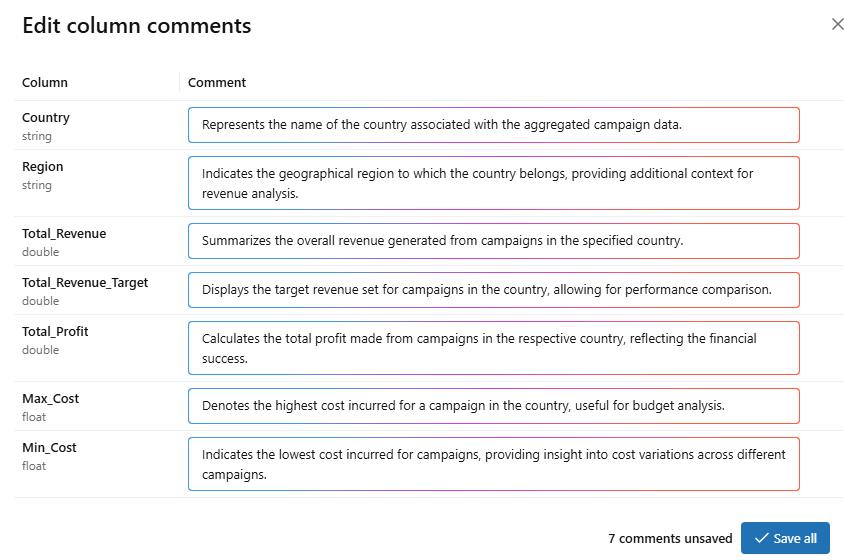
On the Overview tab, select AI generate to automatically create column descriptions by using Azure Databricks data intelligence.
-
Review the descriptions that the system generated and then select Save all.