Task 04: Create a real-time dashboard by using Copilot
Introduction
Real-time dashboards provide immediate visibility into streaming data using visuals that update automatically.
Description
In this task, you’ll use Microsoft Fabric real-time intelligence and Copilot to create a real-time dashboard based on a streaming table named thermostat.
Example scenario
Operations leaders monitor live dashboards during critical sales events.
Success criteria
A real-time dashboard displays live telemetry data.
Learning resources
- Real-time dashboards in Fabric
- Copilot for real-time analytics
Key steps
01: Create a real-time dashboard from streaming telemetry
-
Open Microsoft Edge and go to Power BI.
-
If prompted, sign in by using the following credentials:
Setting Value Username @lab.CloudPortalCredential(User1).UsernameTemporary Access Pass (TAP) token @lab.CloudPortalCredential(User1).AccessToken -
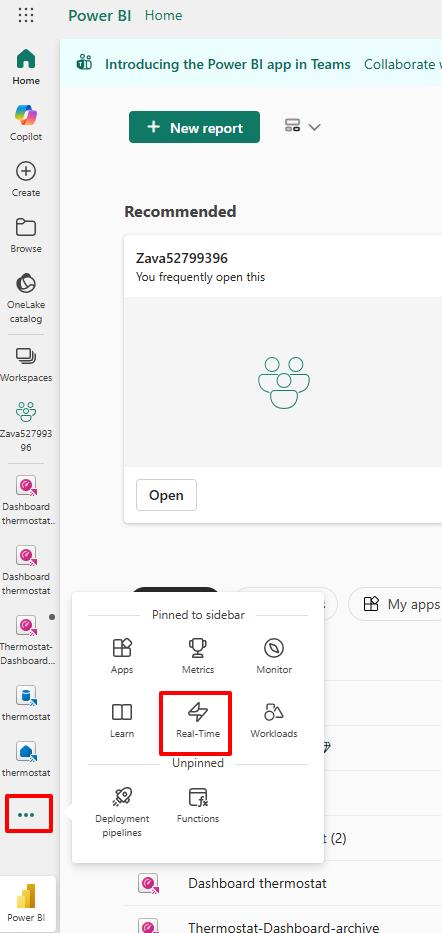
From the left navigation bar, select Real-Time.
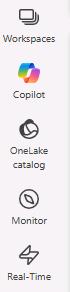
If the Real-Time hub not visible in the left navigation pane, Select the ellipses (…) at the bottom of the left pane. Select More navigation options. Locate and select Real-Time.
-
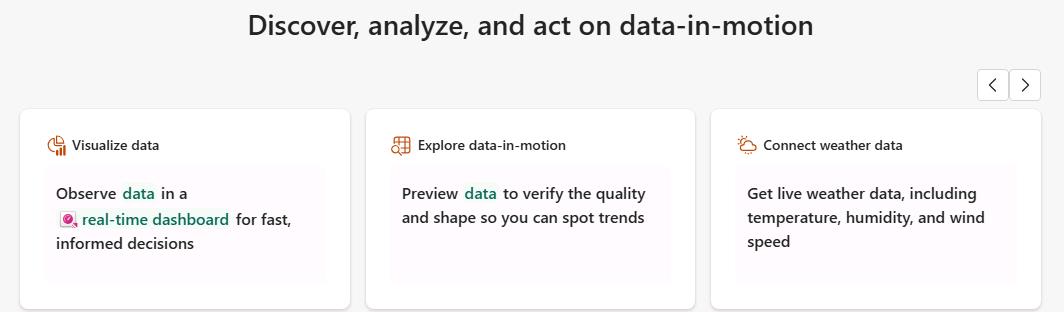
On the Real-Time hub landing page, select the Visualize data tile.
{: .warning }\
You may need to select the arrows at the top right of the page to see the tile.
-
In the New Real-Time Dashboard dialog, in the Name field, enter
Thermostat dashboardand then select Create.
-
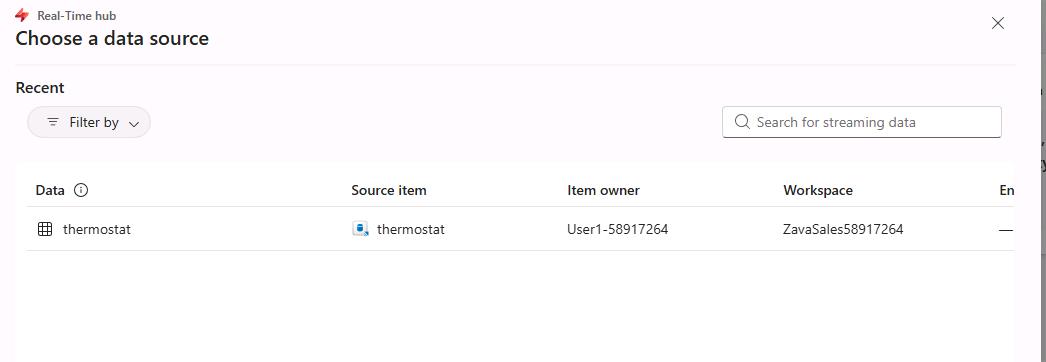
In the Choose a data source dialog, select thermostat and then select Choose.
-
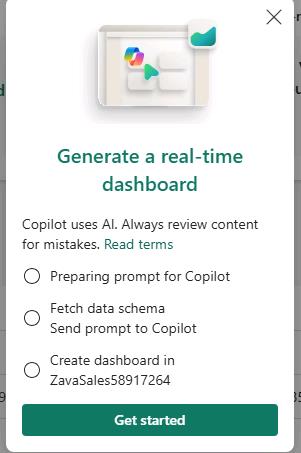
In the confirmation dialog, select Get started. Fabric automatically:
- Connects to the underlying Eventhouse / KQL Database
- Creates a Real-Time Dashboard
- Opens the dashboard editor
-
Return to the PowerShell window that you launched in Task 1 and stop the simulator by using the Ctrl + C key combination.