Task 03: Analyze data by using KQL and anomaly detection
Introduction
Once data is streaming into the KQL database, you can analyze it using KQL and configure alerts for anomalies.
Description
In this task, you’ll query streaming data and configure anomaly detection and alerts.
Example scenario
Sudden temperature drops may indicate equipment failure and require immediate attention.
Success criteria
Queries return results and alerts trigger when conditions are met.
Learning resources
- Kusto Query Language (KQL) basics
- Anomaly detection in Fabric
Key steps
01: Query streaming data and configure anomaly detection
-
Open Microsoft Edge and go to
https://app.powerbi.com/. -
If prompted, sign in by using the following credentials:
Setting Value Username @lab.CloudPortalCredential(User1).UsernameTemporary Access Pass (TAP) token @lab.CloudPortalCredential(User1).AccessToken -
In the left pane, select the Zava@lab.LabInstance.Id workspace.
-
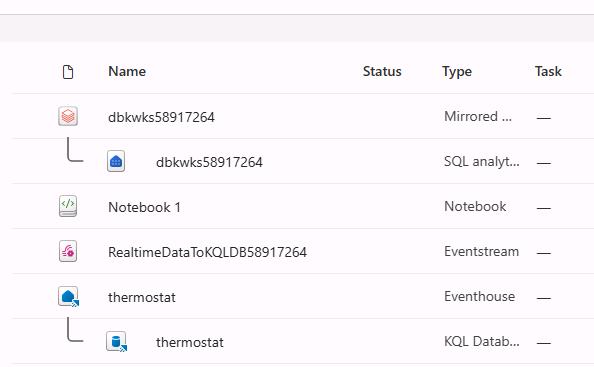
In the list of resources, select the thermostat KQL database.
Be sure to select the thermostat KQL database resource and not the thermostat Eventhouse resource.
-
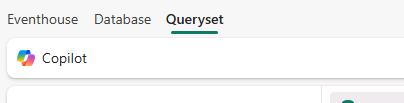
On the command bar for the database, select Query with code.

-
On the command bar for the database, select Copilot.
-
Submit the following prompt:
What is the average temperature per day? -
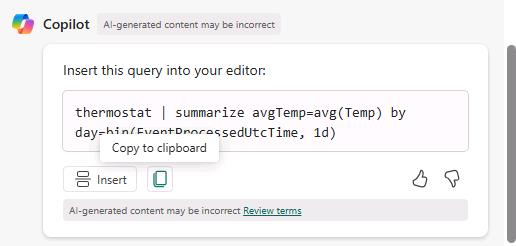
In the response from Copilot, select Copy to clipboard>
-
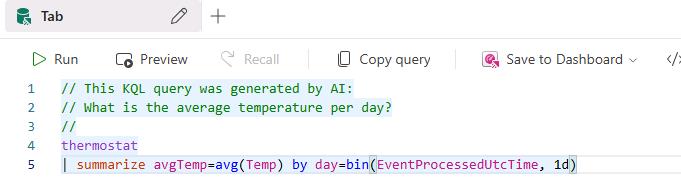
Paste the query from Copilot into the query window.
Sometimes when you paste responses from the Copilot window, in addition to pasting the comments and code, HTML markup gets pasted.

You must remove the HTML markup tags that appear before or after the comments and code.
-
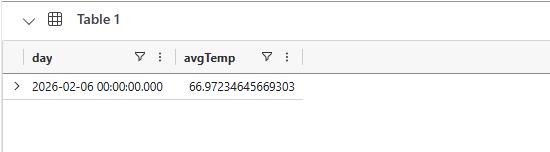
On the command bar, select Run.

-
In the left pane, select the Zava@lab.LabInstance.Id workspace.
-
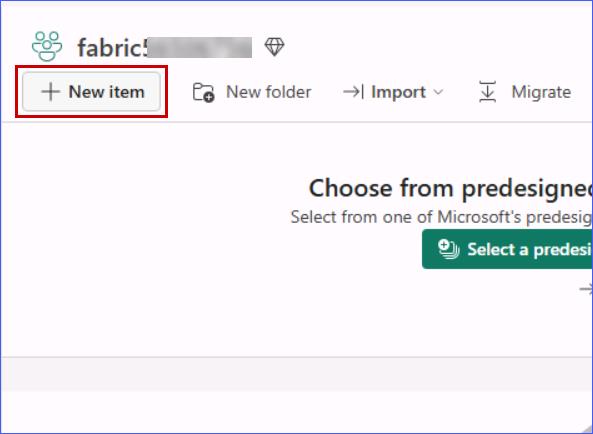
On the command bar, select + New item.
-
Search for
Activator.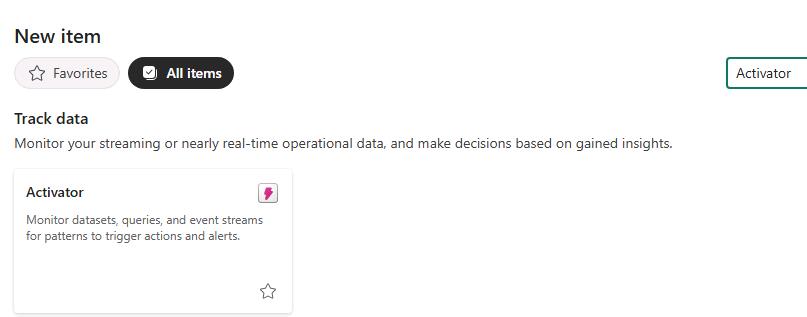
-
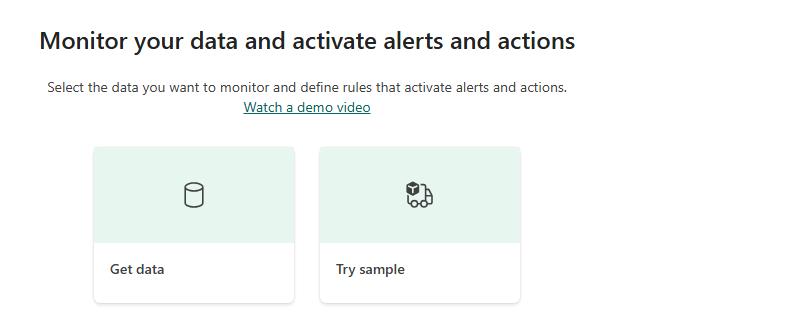
Select Get data.
-
In the Data section, select RealtimeDataTo-KQLDB-stream.

-
Select Next.
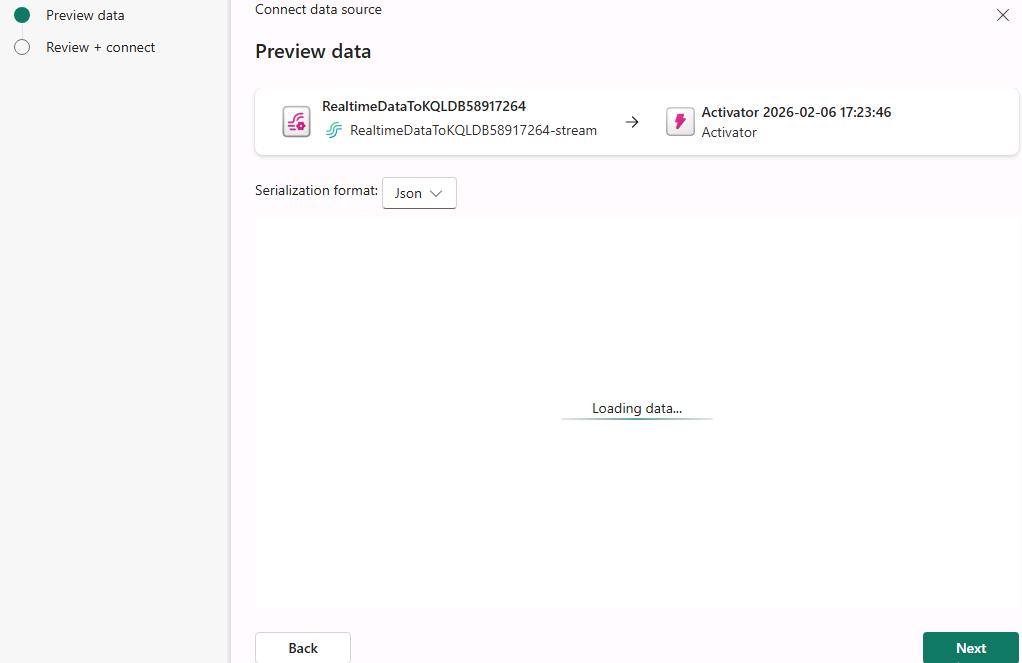
-
[]Select Connect.
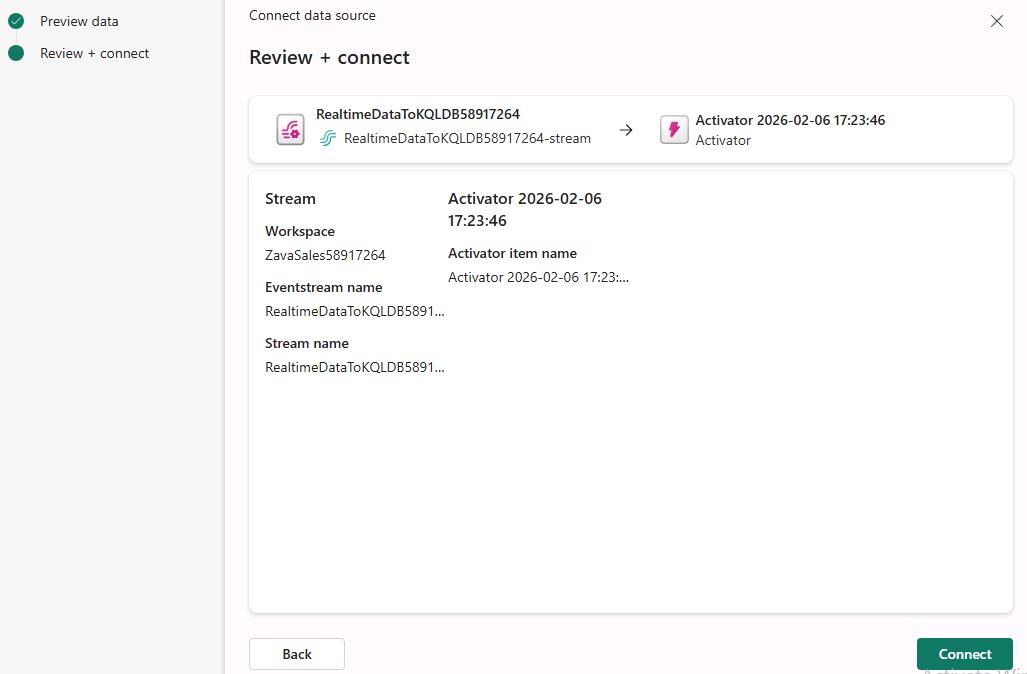
-
Select Finish.
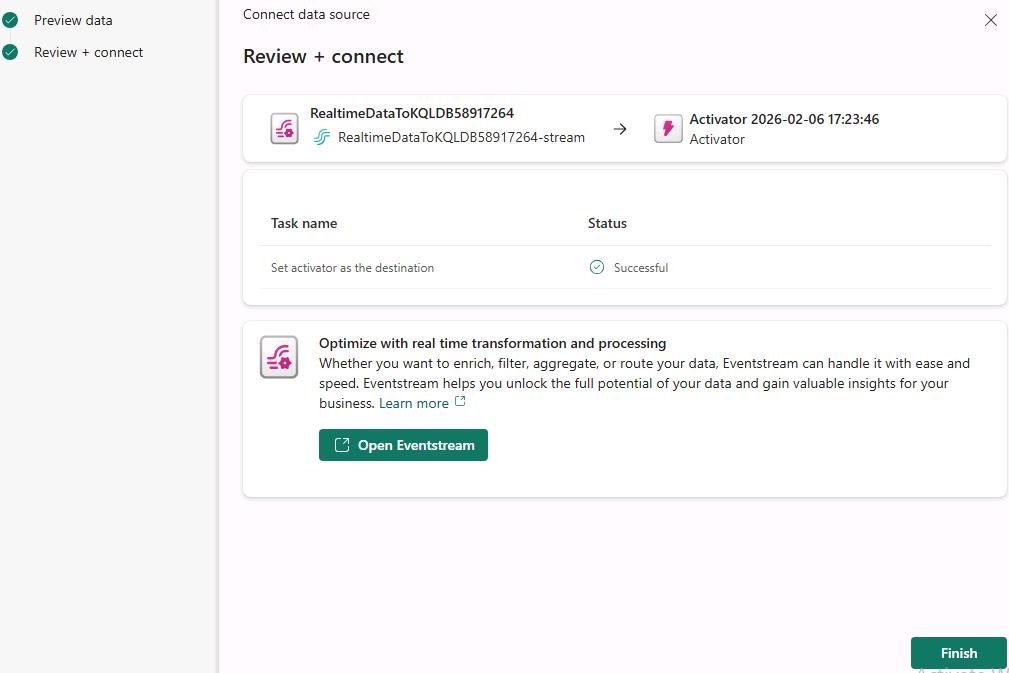
-
Select New Object.
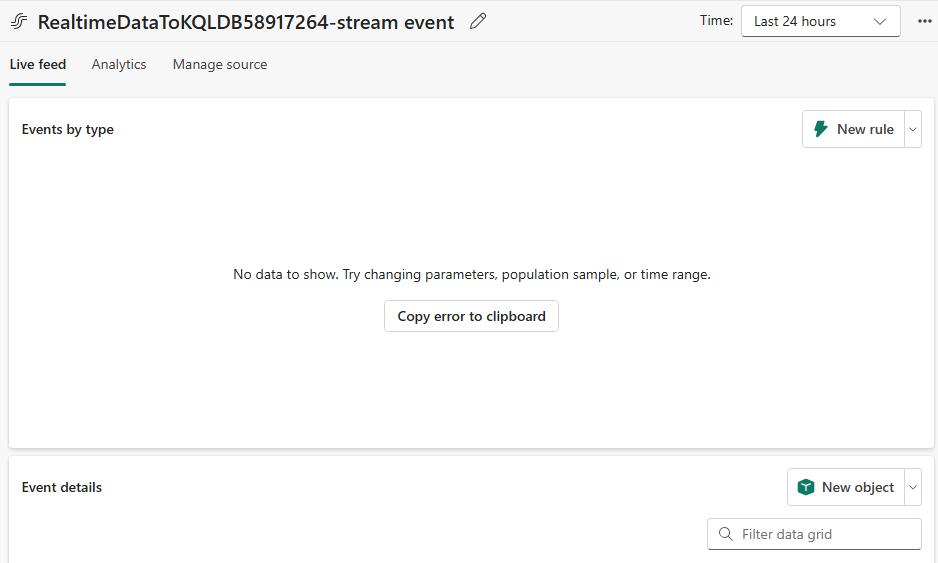
-
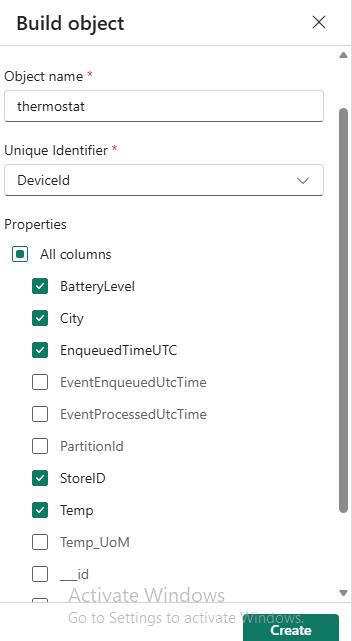
Configure the Build object pane by using the following information:
Field Value Object Name Thermostat Unique identifier Device Id You may not be able to enter information into these fields until you start seeing data in the Event details pane that appears at the bottom of the window.
It may take a couple of minutes before you start seeing data. If you cannot configure the object, close the Build object pane and select New object to reopen the pane.
-
Select each of the following properties:
- Battery level
- City
- Temp
- StoreID
- EnqueuedTimeUTC
-
Select Create.
-
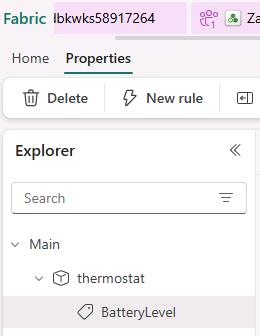
In the Explorer pane, in the Thermostat node, select Battery level.
-
In the right pane, select New rule.

-
Configure the alert rule Condition section by using the following information:
Field Value Condition Decreases below Value 10Occurrence Every time the condition is met 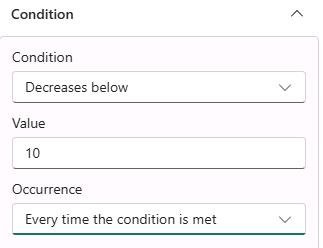
-
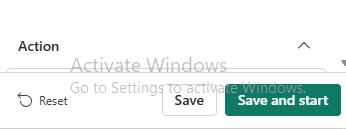
Select Save and Start.
-
Once we have streaming data which matches with the alert condition we should start seeing Email actions getting triggered.