Task 01: Build machine learning models and experiments by using Copilot in Fabric
Introduction
Microsoft Fabric offers data science experiences to empower users to complete end-to-end data science workflows for data enrichment and business insights. You can complete a wide range of activities across the entire data science process, all the way from data exploration, preparation, and cleansing, to experimentation, modeling, model scoring, and serving predictive insights to BI reports. Copilot responds to queries in natural language or generates customized code snippets for tasks like creating charts, filtering data, applying transformations, and building machine learning models.
Description
To understand the cause behind Zava’s declining revenue, the team needed to dive deeper into their customers’ spending patterns. Let’s see how Copilot for Notebook helps you, as a Data Scientist, quickly create Data Science Notebooks.
Example scenario
A data scientist investigates churn patterns to identify at-risk customers and recommend retention strategies.
Success criteria
Models run successfully and outputs are generated from the notebook.
Learning resources
- Copilot for data science
- End-to-end ML workflows in Fabric
Key steps
01: Import a notebook and explore customer churn data with Copilot
-
In the left pane, select the ZavaSales@lab.LabInstance.Id workspace.
-
Select Import, select Notebook, and then select From this computer to upload a notebook.

-
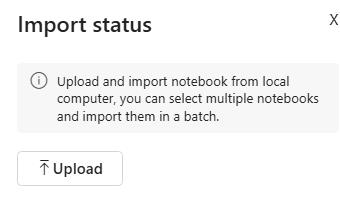
In the Import status pane, select Upload.
-
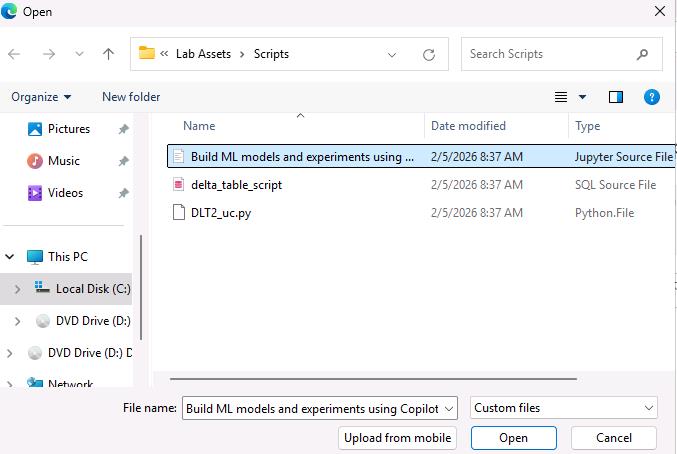
In the File Open dialog, go to
C:\Lab Assets\Scripts. Select Build ML models and experiments using Copilot for Data Science in Fabric_fixed notebook. -
Select Open. Wait for the notebook to upload.
-
At the bottom of the Workspace, select the Build ML models and experiments using Copilot for Data Science in Fabric_fixed notebook.
-
In the Explorer pane, next to Onelake, select the ellipses (…) and then select Remove all sources.
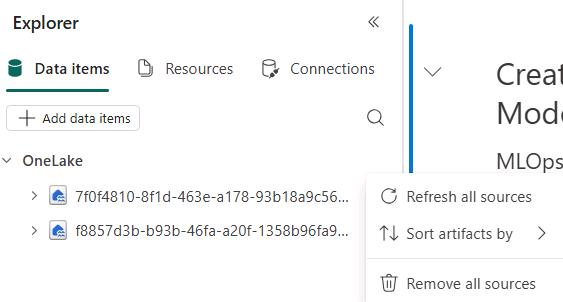
It is important to remove all existing sources. The connections were made by using credentials from a previous lab instance.
-
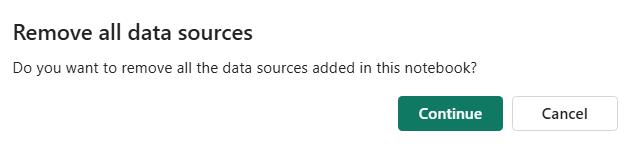
In the confirmation dialog, select Continue.
-
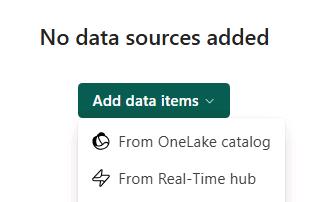
Select Add data items and then select From OneLake Catalog.
-
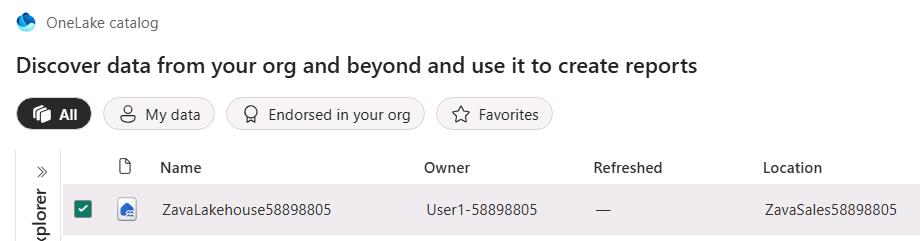
Select the lakehouse checkbox and then select Connect.
For some deployments, you may need to select Add instead of Next.
-
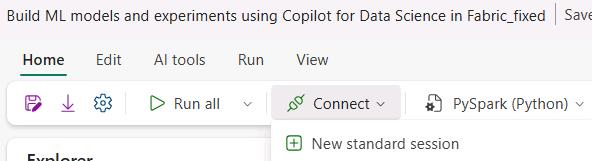
On the command bar, select Connect and then then select New standard session.
-
In the notebook, move down to locate the Feature 1: Chat Panel cell.
-
Replace the code in the cell with the following code:
spark_df = spark.table('ZavaSales@lab.LabInstance.Id.ZavaLakehouse@lab.LabInstance.Id.dbo.customerchurndata') df = spark_df.toPandas() -
Move down the page to locate the Step 1: Load customer churn (labeled) data from silver layer Delta tables into Spark DataFrame code cell.
-
Replace the code in the cell with the following code:
df = spark.sql("SELECT * FROM ZavaSales@lab.LabInstance.Id.ZavaLakehouse@lab.LabInstance.Id.dbo.customerchurndata") df.show(6) -
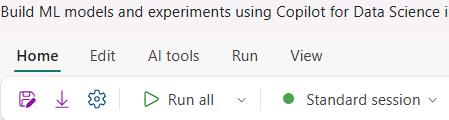
On the command bar, select Run all.
-
Review the output from each cell.