Task 01: Create a Semantic model and generate insights by using Copilot for Power BI
Introduction
Based on all the gathered data, Wendy is expected to create Power BI reports for other data citizens and stakeholders. Let’s step into her shoes to experience the power of Copilot for Power BI in conjunction with Direct Lake Mode.
Description
In this task, you’ll create a semantic model from lakehouse data and use Copilot to generate reports and insights using natural language.
Example scenario
Wendy needs to quickly understand customer behavior trends and share insights with stakeholders using Power BI.
Success criteria
A Power BI report is created and enhanced using Copilot-generated visuals and insights.
Learning resources
- Copilot for Power BI overview
- Semantic models in Fabric
Key tasks
01: Create a semantic model and generate insights with Copilot
-
Open Microsoft Edge and go to Power BI.
-
If prompted, sign in.
-
Select Workspaces and then select ZavaSales@lab.LabInstance.Id.
-
Select the lakehouse.

-
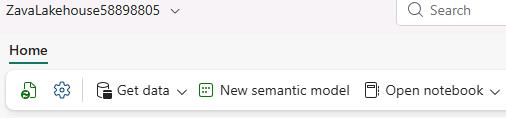
On the command bar, select New semantic model.
-
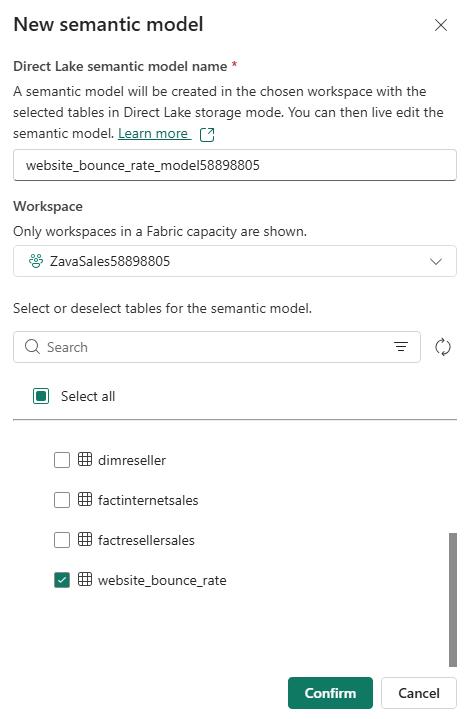
In the New semantic model dialog, enter
website_bounce_rate_model@lab.LabInstance.Id -
In the Tables section, locate and select the website_bounce_rate and then select Confirm.
-
Wait for the system to create the semantic model. This process may take a couple of minutes.
-
On the command bar, select Settings (the gear icon) and then select Power BI settings.
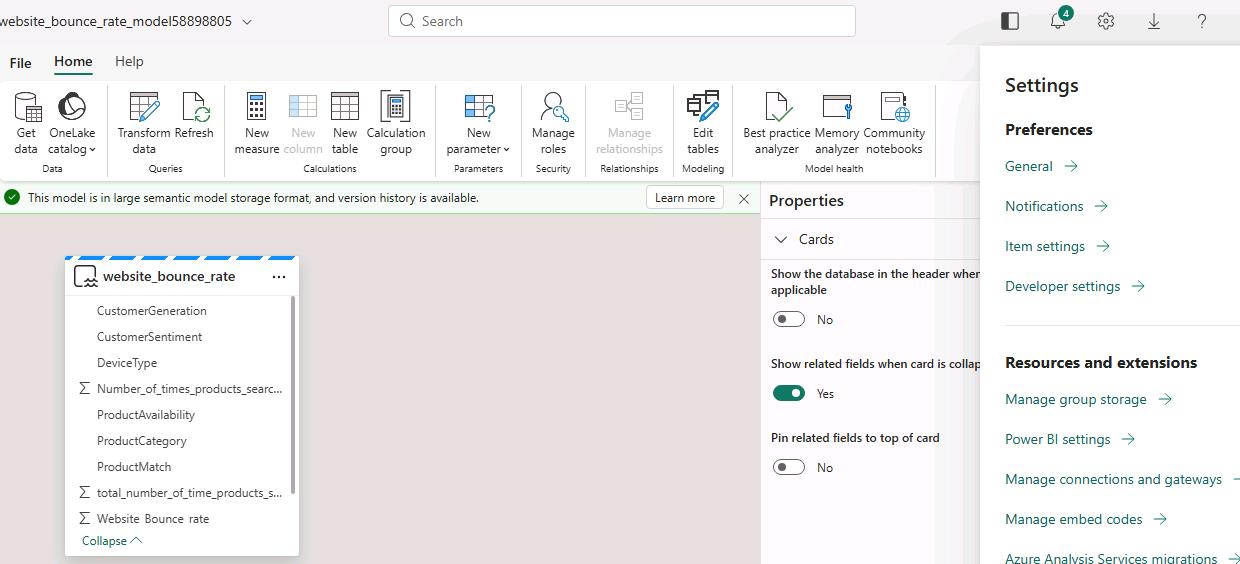
If the settings icon is not visible, select the ellipses (…) next to the Profile icon and then select Settings.
-
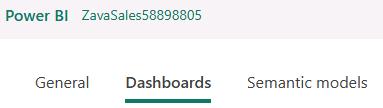
On the command bar, select Semantic models.
-
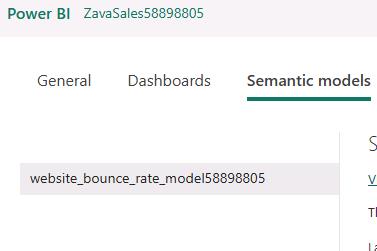
In the list of models that displays on the left side of the page, select the website_bounce_rate_model model.
-
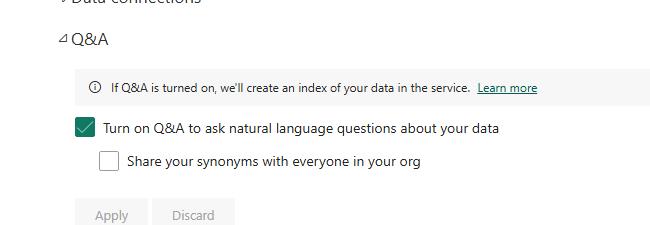
Move down the page and select the Q&A section.
-
Select Turn on Q&A to ask natural language questions about your data and then select Apply.
In newer deployments, this option may be turned on by default.
-
In the left pane, select the Zavasales@lab.LabInstance.Id workspace.

-
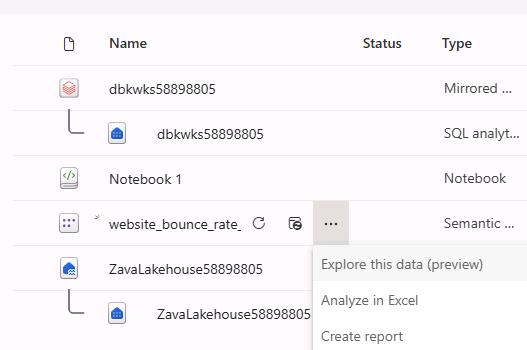
In the list of resources, select the ellipses (…) next to the website_bounce_rate_model semantic model and then select Create report.
-
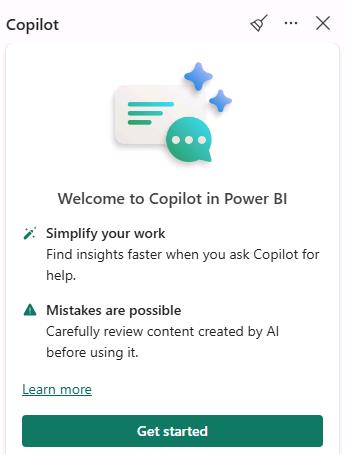
On the command bar, select Copilot.

-
In the Copilot pane, toggle the Preview switch on then select Get Started.
-
Submit the following prompt:
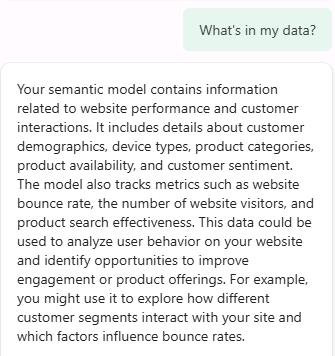
What's in my data? -
Review the response.
‘What’s in my data?’ provides an overview of the contents of the dataset, identifies and describes what’s in it and what the attributes are about. So, there’s no need to wait for someone to explain the dataset. This improves the efficiency and volume of report creation.
-
Submit the following prompt:
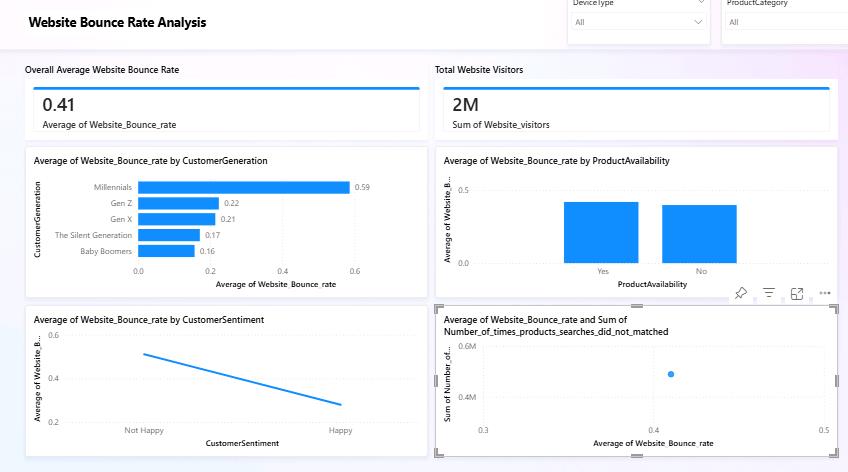
Create a detailed page to analyze the Website Bounce Rate.If you see the error message saying, ‘Something went wrong.’, try refreshing the page and restarting the task.
Your results will likely differ from the screenshot below.
-
Review the response.
The report shows that the website bounce rate for Zava is especially high amongst the Millennial customer segment.
-
Submit the following prompt:
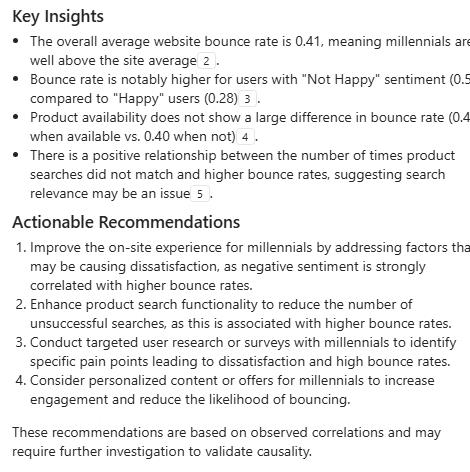
Based on the data in the page, what can be done to improve the bounce rate of millennials? -
Copilot creates the desired Power BI report and even goes a step further to give powerful insights.
-
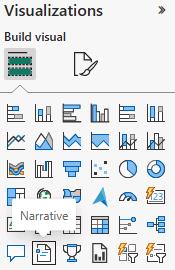
In the Visualizations pane, select the Narrative visual from the Visualizations pane it to the report canvas.
-
Resize visualization to fit the report canvas.
-
Within the visualization, select Copilot (preview).
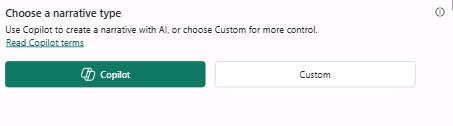
-
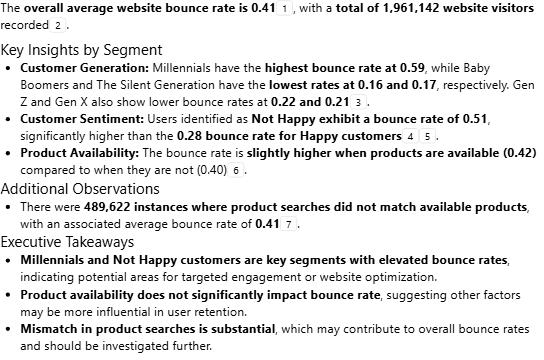
Submit the following prompt and then select Update:
Summarize the data, provide an executive summary, indicating important takeaways.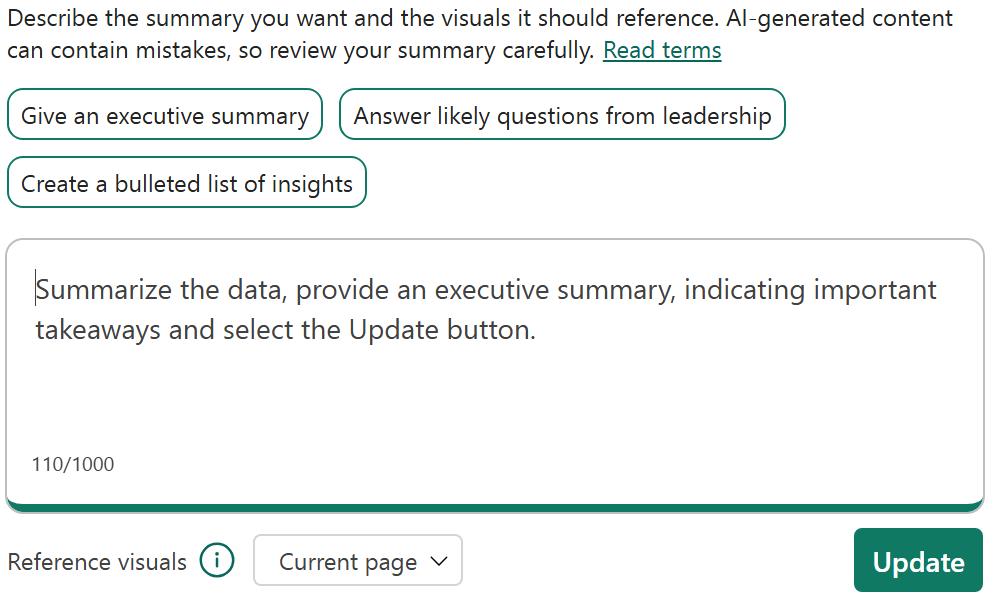
-
On the command bar, select File. Then, select Save. Name the file
website_bounce_rate_rptand then select Save.