How to setup Power BI Publish new Power BI reports based on FinOps toolkit starter kits, extend them to include business context, integrate cost data into your existing reports, or migrate from older Cost Management solutions.
On this page
The FinOps toolkit Power BI reports provide a great starting point for your FinOps reporting. We recommend customizing them to keep what works, edit and augment reports with your own data, and remove anything that isn’t needed. You can also copy and paste visuals between reports to create your own custom reports.
FinOps toolkit reports support several ways to connect to your cost data. We generally recommend starting with Cost Management exports, which supports up to $2-5 million in monthly spend. If you experience data refresh timeouts or need to report on data across multiple directories or tenants, please use FinOps hubs, a data pipeline solution that optimizes data and offers additional functionality. For additional details and help choosing the right backend, see Help me choose.
Please note support for the Cost Management connector for Power BI is available for backwards compatibility, but is not recommended. The Microsoft Cost Management team is no longer updating the Cost Management connector and instead recommends exporting data.
Use the guides below to connect and customize FinOps toolkit and other Power BI reports.
➕ Setup your first report
The FinOps toolkit Power BI reports include pre-configured visuals, but are not connected to your data. Use the following steps to connect them to your data:
-
Configure Cost Management exports for any data you would like to include in reports, including:
- Cost and usage (FOCUS) – Required for all reports.
- Price sheet
- Reservation details
- Reservation recommendations – Required to see reservation recommendations in the Rate optimization report.
- Reservation transactions
- Download and open the desired report in Power BI Desktop.
-
Select the Transform data button in the toolbar.

- If connecting to a FinOps hub instance, set the Hub Storage URL.
- Open the list of resource groups in the Azure portal.
- Select the hub resource group.
- Select Deployments in the menu.
- Select the hub deployment.
- Select Outputs.
- Copy the value for
storageUrlForPowerBI.
- If connecting directly to Cost Management exports, set the Export Storage URL.
- Open the desired storage account in the Azure portal.
- Select Settings > Endpoints in the menu.
- Copy the Data Lake Storage URL.
- Append the container and export path, if applicable.
- If only using one storage URL (whether it’s for hubs or exports), paste that same URL in both parameters.
- When only one URL is specified, the Power BI service thinks there is a problem and blocks configuring scheduled refresh.
- To work around this problem, simply copy the same URL into both parameters.
- If using hubs, the export storage URL is never used.
- If using exports, the hub URL will be ignored since exports don’t meet the hub storage requirements.
- These parameters will be merged in a future update.
- Specify how much data you would like to include from storage using one of the following:
- Set Number of Months to the number of closed months you would like to report on if you want to always show a specific number of recent months.
- Set RangeStart and RangeEnd to specific start/end dates if you do not want the dates to move (e.g., fiscal year reporting).
- Do not set any date parameters to report on all data in storage.
Enable incremental refresh to load more than $5M of raw cost details. Power BI reports can only support $2-5M of data when incremental refresh is not enabled. After incremental refresh is enabled, they can support $2-5M/month for a total of ~$65M in raw cost details.
- Select Close & Apply to save your settings.
If you run into any issues syncing your data, see Troubleshooting Power BI reports.
🔑 Use a SAS token to connect data to a report
Shared Access Signature (SAS) tokens allow you to connect to a storage account without end user credentials or setting up a service principal. To connect Power BI reports to your data via SAS tokens:
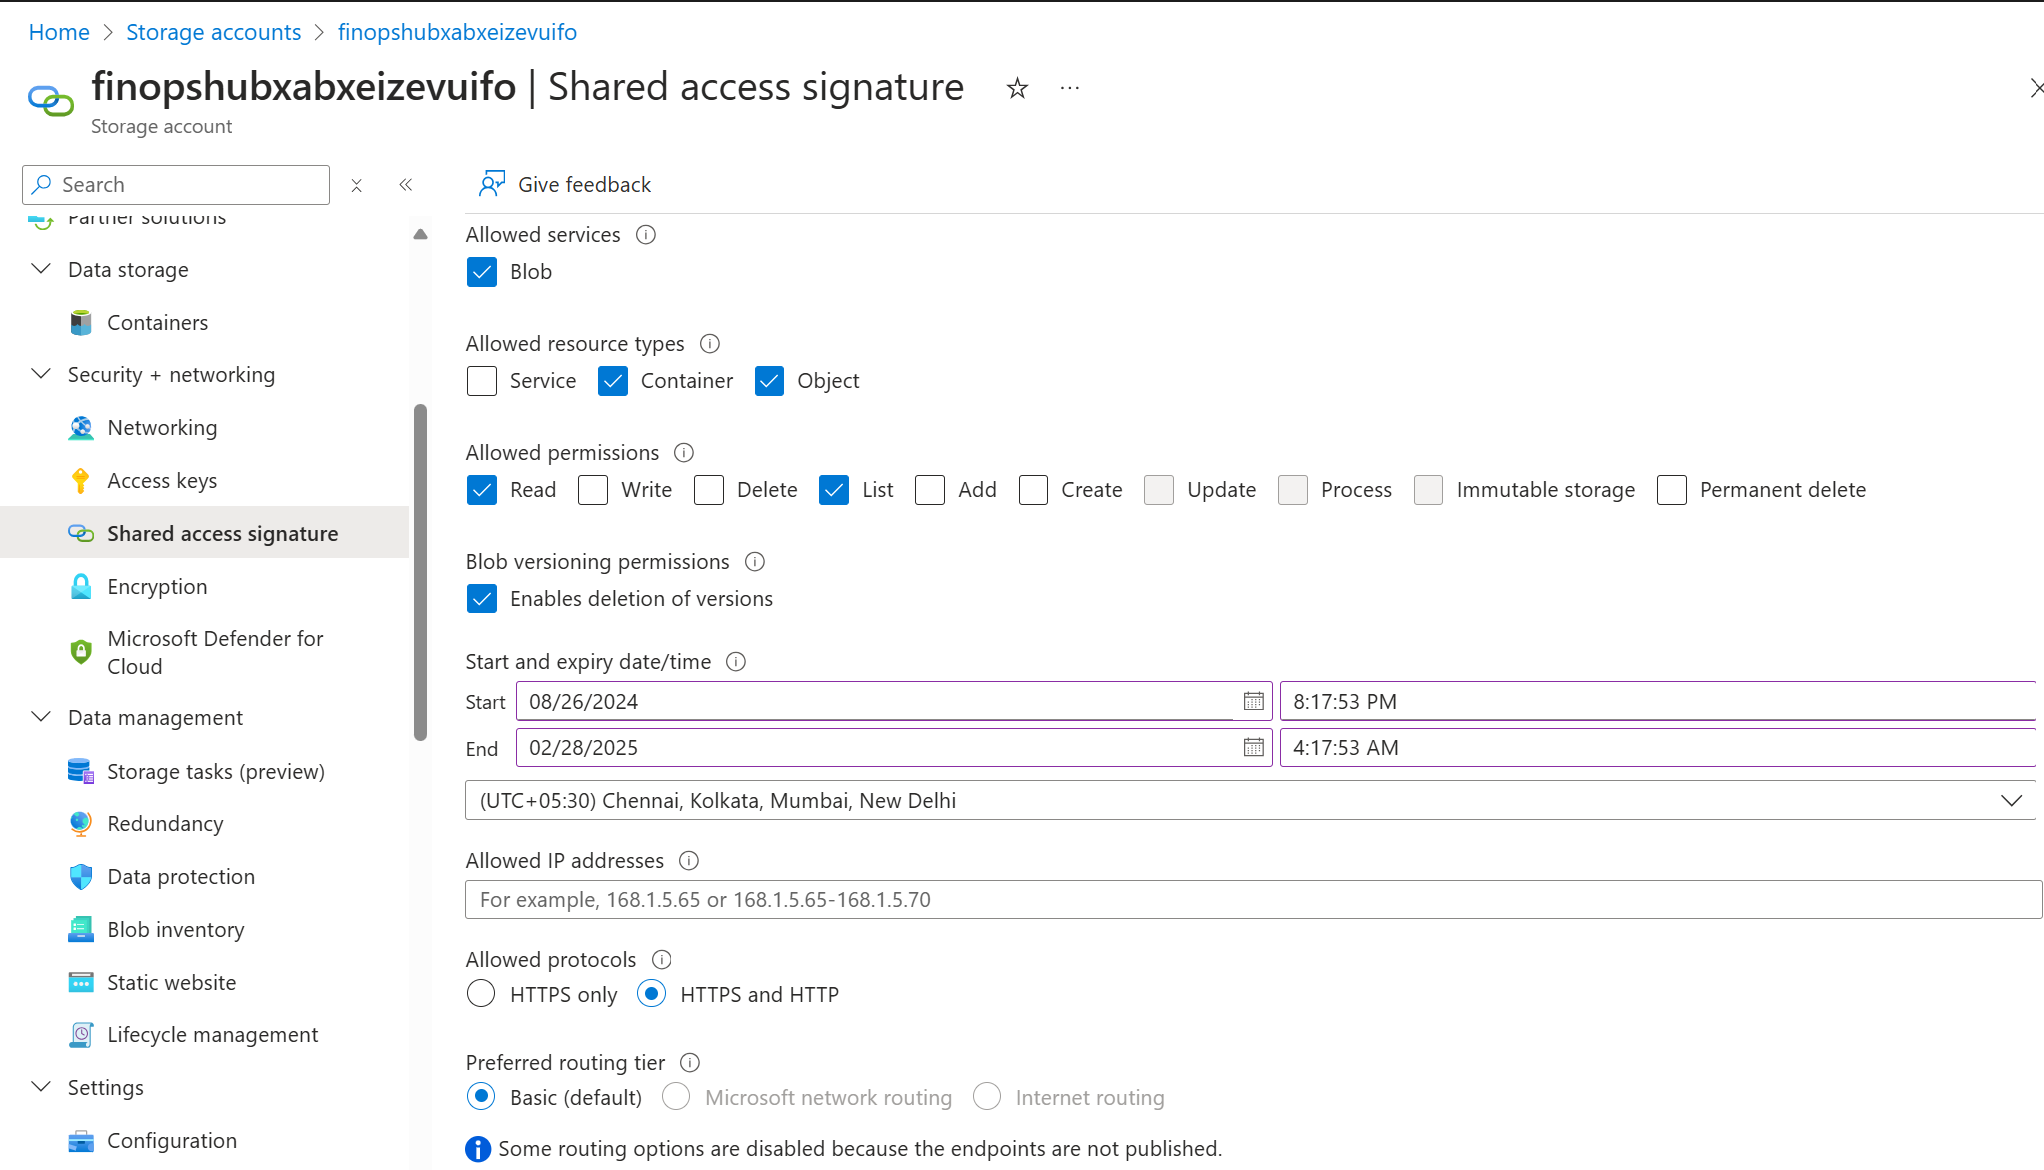
- Generate the SAS token with required permissions:
- Navigate the FinOps hub storage account in the Azure portal.
- Select Security + Networking > Shared access signature in the menu on the left.
- Under Allowed resource types, select
ContainerandObject. - Under Allowed permissions, select Read, List.
- Provide the start and expiration date range as desired.
- Keep the remaining default values or update as desired.
- Select the Generate SAS token and URL button.
- Copy the generated token.
- Configure SAS token access in Power BI:
- Open the report in Power BI Desktop.
- Select Transform data > Data Source Settings in the ribbon.
- Select Edit permissions at the bottom of the dialog.
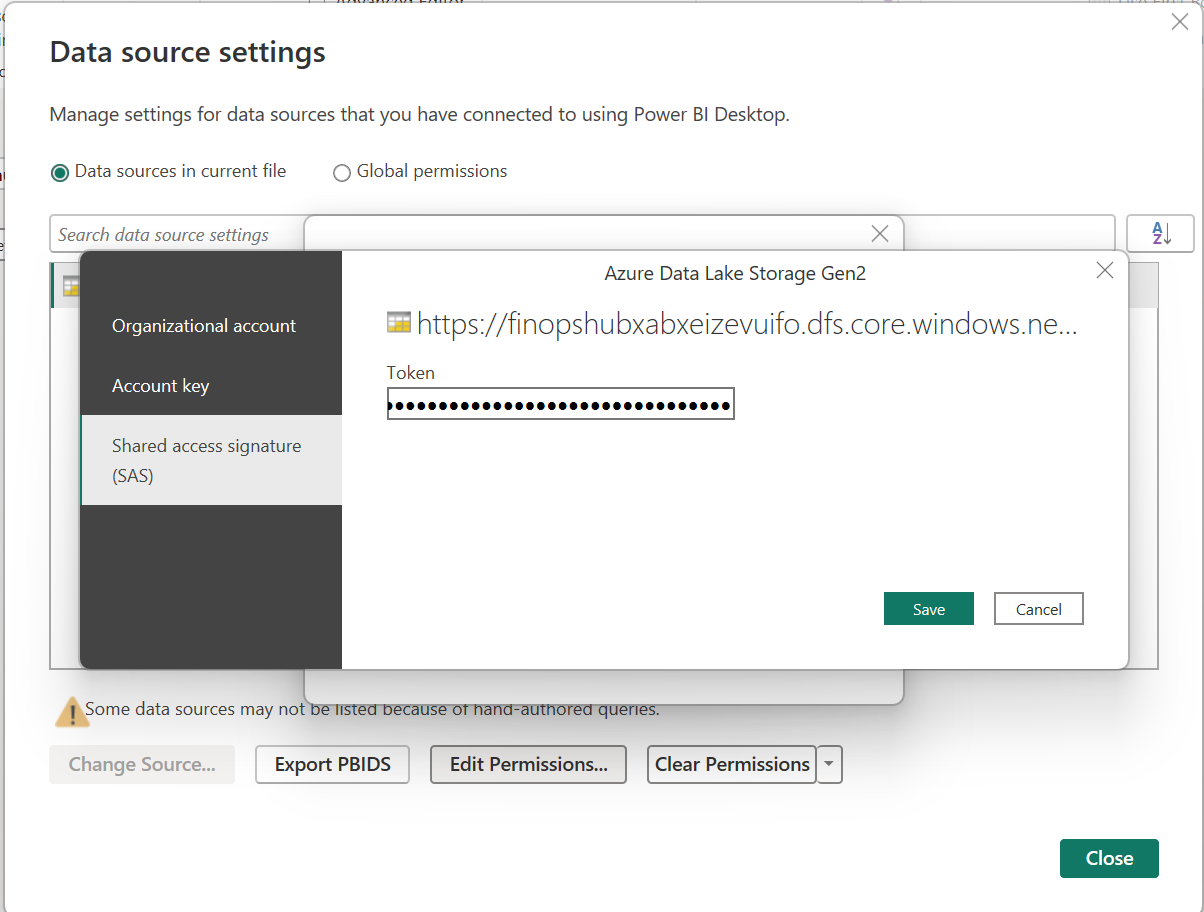
- Select Edit below the credentials.
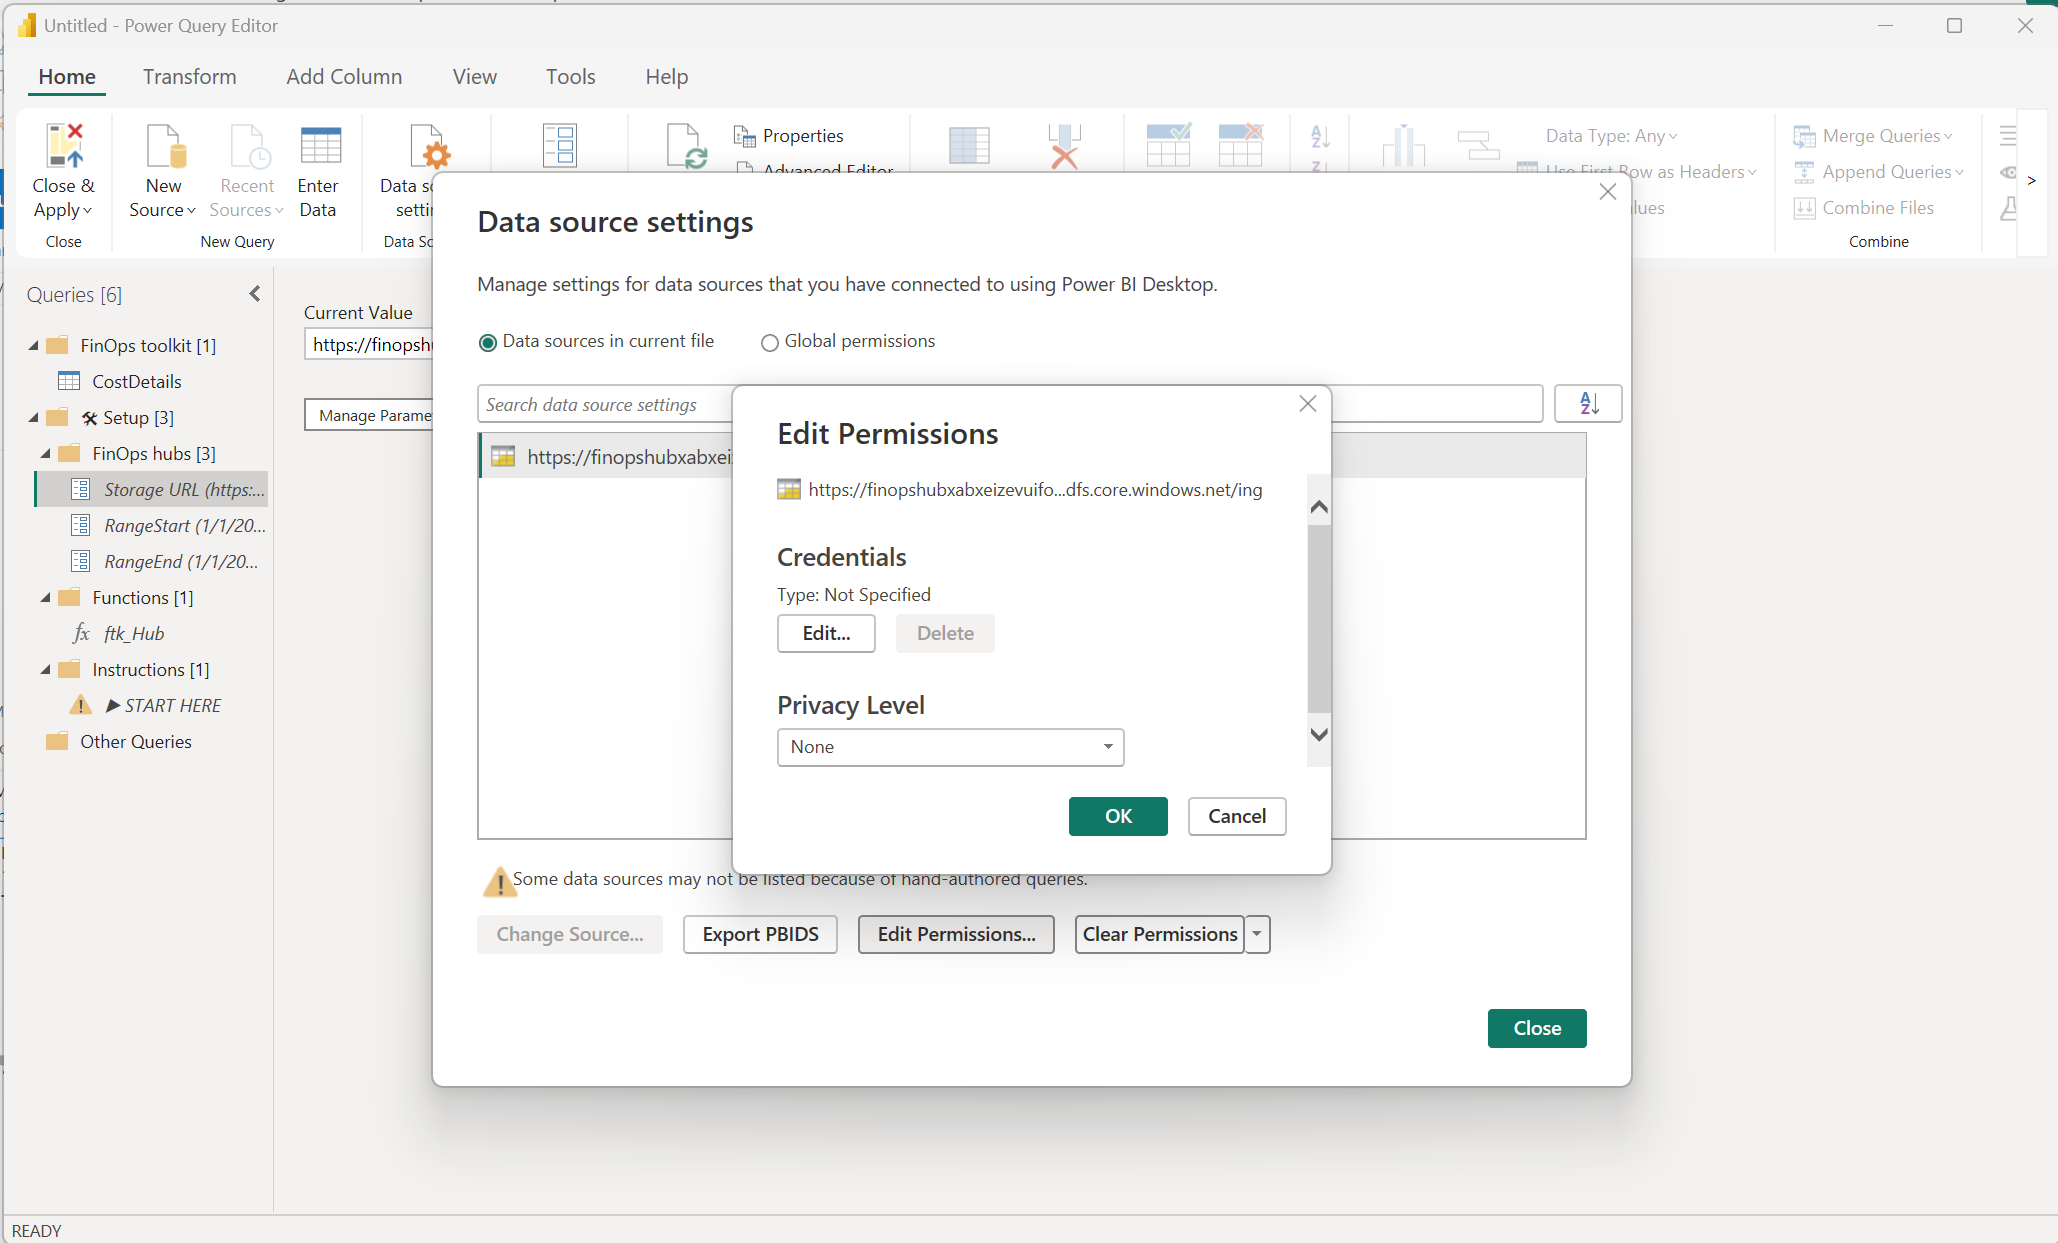
- Select the Shared access signature tab.
- Paste the copied SAS token from the Azure portal.
- Select Save.
- Select Close.
- Select Apply and Close in the ribbon.
📋 Copy queries from a toolkit report
FinOps toolkit reports manipulate the raw data to facilitate specific types of reports. If you need to connect your data to a new or existing Power BI report that doesn’t currently use FinOps toolkit or Cost Management data source, the best option is to copy queries, columns, and measures from a FinOps toolkit report.
- Download one of the FinOps toolkit reports.
- Open the report in Power BI Desktop.
- Select Transform data in the toolbar.
- In the Queries list on the left, right-click Costs (or other query) and select Copy.
- Open your report in Power BI Desktop.
- Select Transform data in the toolbar.
- Right-click the empty space in the bottom of the Queries pane and select New group….
- Set the name to
FinOps toolkitand select OK. - Right-click the FinOps toolkit folder and select Paste.
- Select Close & Apply in the toolbar for both reports.
At this point, you have the core data from the FinOps toolkit reports, extended to support Azure Hybrid Benefit and FOCUS reports. In addition to these, you may also be interested in the custom columns and measures that summarize savings, utilization, cost over time, and more. Unfortunately, Power BI doesn’t provide a simple way to copy columns and measures. Perform the following for each column and measure you’d like to copy:
- In the FinOps toolkit report, expand the Costs (or other table) table in the Data pane on the right.
- Select a custom column or measure, then copy the formula from the editor at the top of the window, under the toolbar.
Be sure to make note if this is a column or a measure. Columns have a table icon with a “Σ” or “fx” symbol and measures have a calculator icon.

- In your report, right click the Costs table and select New measure or New column based on what you just copied.
- When the formula editor is shown, paste the formula using Ctrl+V or Cmd+V.
- Repeat steps 2-4 for each desired column and measure.
Note that some columns and measures depend on one another. You can ignore these errors as you copy each formula. Each will resolve itself when the dependent column or measure is added.
For details about the columns available in Power BI, refer to the data dictionary.
🛠️ Connect manually
If you don’t need any of the custom columns and measures provided by the FinOps toolkit reports, you can also connect directly to your data using one of the built-in Power BI connectors.
If using the Cost Management connector, refer to Create visuals and reports with the Cost Management connector.
If using exports or FinOps hubs, you’ll use the Azure Data Lake Storage Gen2 connector:
- Open your desired report in Power BI Desktop.
- Select Get data in the toolbar.
- Search for
lakeand select Azure Data Lake Storage Gen2 - Set the URL of your storage account.
- If using FinOps hubs, copy the URL from deployment outputs:
- Open the list of resource groups in the Azure portal.
- Select the hub resource group.
- Select Deployments in the menu.
- Select the hub deployment.
- Select Outputs.
- Copy the value for
storageUrlForPowerBI.
- If using raw exports, copy the URL from the storage account:
- Open the desired storage account in the Azure portal.
- Select Settings > Endpoints in the menu.
- Copy the Data Lake Storage URL.
- Append the container and export path, if applicable.
- If using FinOps hubs, copy the URL from deployment outputs:
- Select the OK button.
If you receive an “Access to the resource is forbidden” error, grant the account loading data in Power BI the Storage Blob Data Reader role.
- Select the Combine button.
- Select the OK button.
For more details about connecting to Azure Data Lake Storage Gen2, see Connect to ADLS Gen2. For details about the columns available in storage, refer to the data dictionary.
🚚 Migrate from the Cost Management template app
The Cost Management template app does not support customization in Power BI Desktop and is only supported for Enterprise Agreement (EA) accounts. We recommend starting from one of the FinOps toolkit reports that work across account types rather than customizing the template app. If would like to customize or copy something from the template, see Cost Management template app.
🏗️ Migrate from the Cost Management connector
The Cost Management connector provides separate queries for actual (billed) and amortized costs. In an effort to minimize data size and improve performance, the FinOps toolkit reports combine these into a single query. The best way to migrate from the Cost Management connector is to copy the queries from a FinOps toolkit report and then update your visuals to use the Costs table.
- Download one of the FinOps toolkit reports.
- Open the report in Power BI Desktop.
- Select Transform data in the toolbar.
- In the Queries list on the left, right-click Costs and select Copy.
- Before you change your report, make a copy first to ensure you can rollback if needed.
- Open your report in Power BI Desktop.
- Select Transform data in the toolbar.
- Right-click the empty space in the bottom of the Queries pane and select New group….
- Set the name to
FinOps toolkitand select OK. - Right-click the FinOps toolkit folder and select Paste.
- Right-click the Costs query and select Advanced Editor.
- Copy all text and close the editor dialog.
- Right-click the Usage details query and select Advanced Editor.
- Replace all text with the copied text from Costs and select the Done button.
- Rename the Usage details query to
Costsand drag it into theFinOps toolkitfolder. - Delete the Usage details amortized query.
- Select Close & Apply in the toolbar for both reports.
- Review each page to ensure the visuals are still working as expected. Update any references to old columns or measures to the new names.
- Start at the report level:
- In the Data pane, expand each custom table and check custom columns and measures.
- In the Filters pane, check Filters on all pages.
- Then check each page:
- In the Filters pane, check Filters on this page.
- Then check each visual on each page:
- In the Filters pane, check Filters on this visual.
- In the Visualizations pane, check Fields.
If the column name was customized and you aren’t sure what the original name was, right-click the field and select Rename for this visual, then delete the name, and press Enter to reset the name back to the original column name.
- Start at the report level:
If interested in custom columns and measures, see Copy queries from a toolkit report for required steps.
🧰 Related tools
- 🏦 FinOps hubs – Open, extensible, and scalable cost reporting.