Task 02: Apply best practices for efficient querying
Introduction
The Sentinel Data Lake scans large parquet files during query execution. Inefficient KQL can greatly increase scan time, cost, and the likelihood of hitting row or result limits.
This task introduces core optimization practices that help improve performance, reduce compute overhead, and streamline downstream analysis.
Description
You will run several queries demonstrating how to restrict the time range, apply selective filters early, project only required columns, discover schema, and use summaries or KQL Jobs for long-range analytics.
Success criteria
- A tight time filter is applied to reduce scanned data.
- High-value filters are applied early.
- Only required fields are projected.
getschemais used for table exploration.- Summaries/KQL Jobs are understood as a pattern for large datasets.
Key steps:
-
Restrict the time range.
Expand here for detailed steps
Large, unbounded time windows force the Lake to scan excessive parquet files. A narrow time filter drastically improves performance.
- In the Defender portal, go to Microsoft Sentinel > Data Lake Exploration > KQL Queries.
-
Run the following query:
 SecurityIncident
 | where TimeGenerated > ago(7d)
Benefits:
- Reduces data scanned
- Accelerates execution
- Prevents hitting row or result-size limits
-
Filter early on high-value fields.
Expand here for detailed steps
Apply the most selective filters at the top of your query. This reduces the rowset before projecting or summarizing.
-
Run the following query:
 SecurityIncident
 | where TimeGenerated > ago(7d)
 | where ProviderName == "Microsoft XDR"
 | where Severity in ("High", "Medium", "Informational")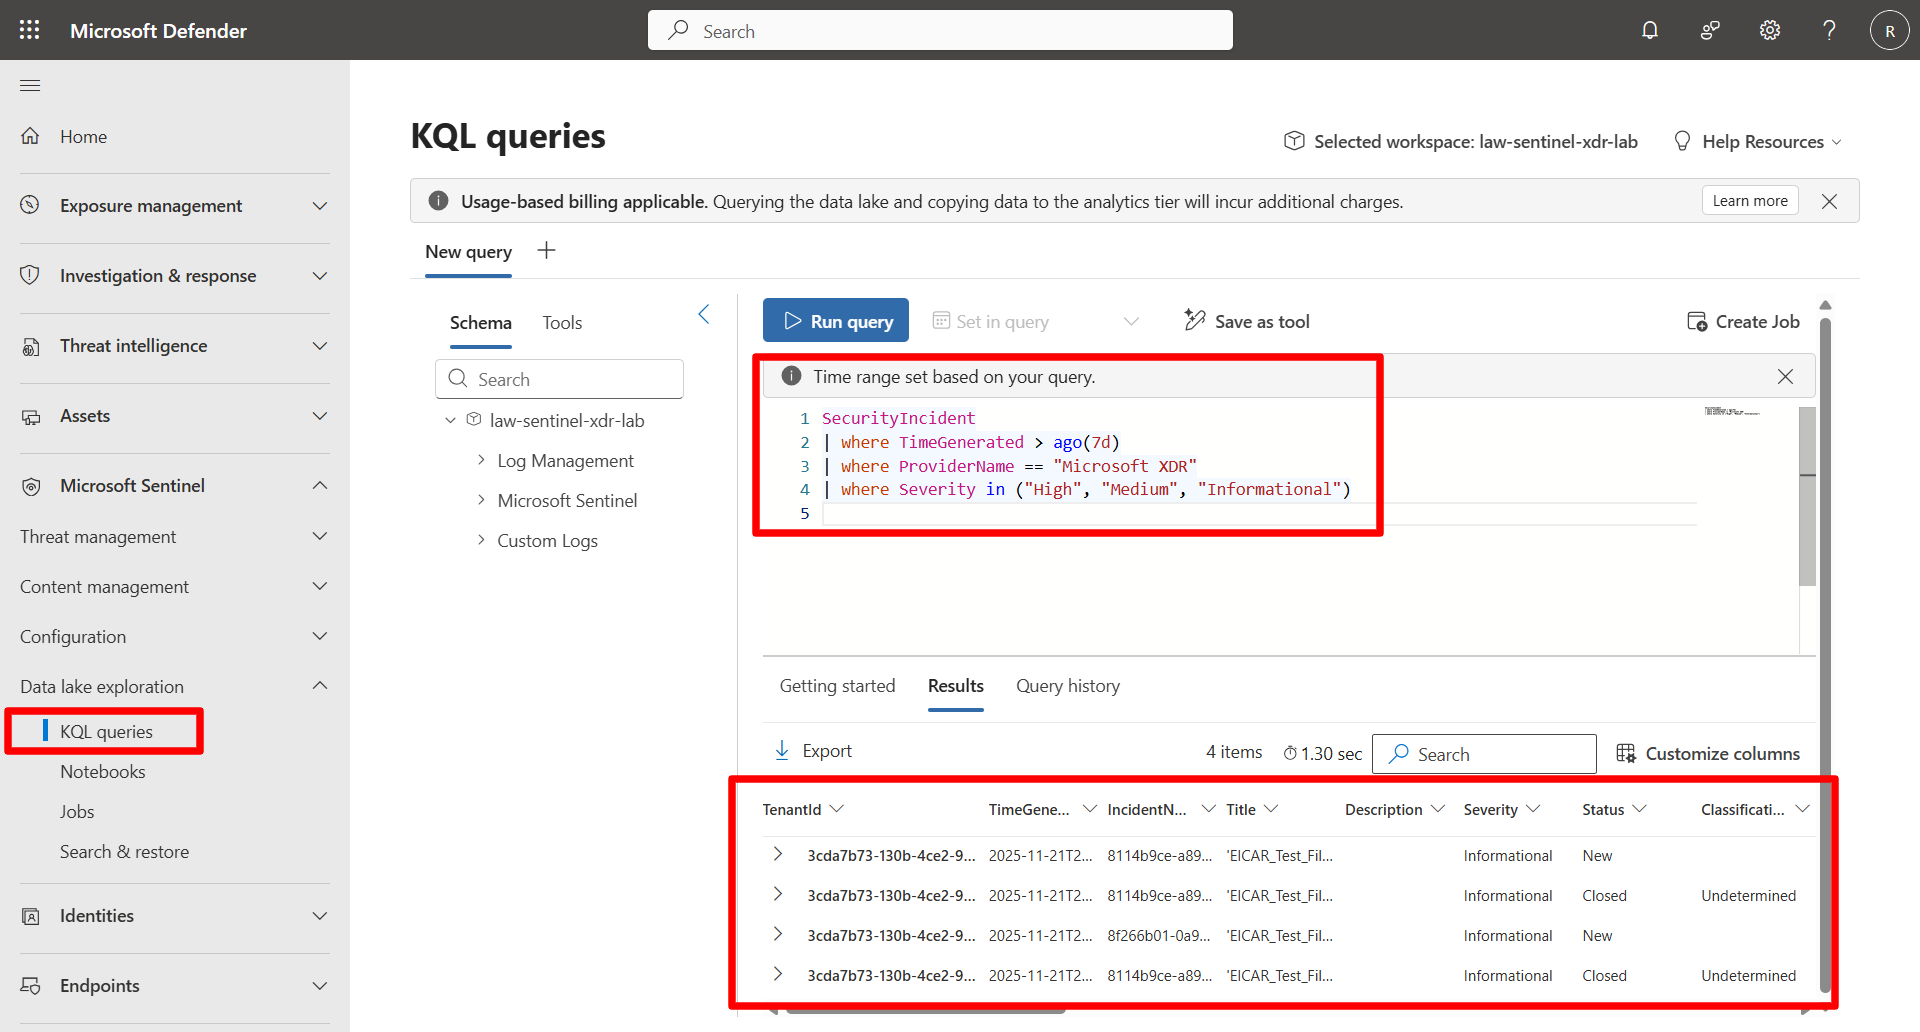
Benefits:
- Removes irrelevant rows immediately
- Minimizes downstream processing
- Faster & more efficient scanning
-
-
Project only required columns.
Expand here for detailed steps
By default, KQL returns all columns. Explicit projection reduces payload size and makes dashboards clearer.
-
Run:
 SecurityIncident
 | where TimeGenerated > ago(7d)
 | where Severity in ("High", "Medium", "Informational")
 | project TimeGenerated, IncidentName, Severity, Owner, Status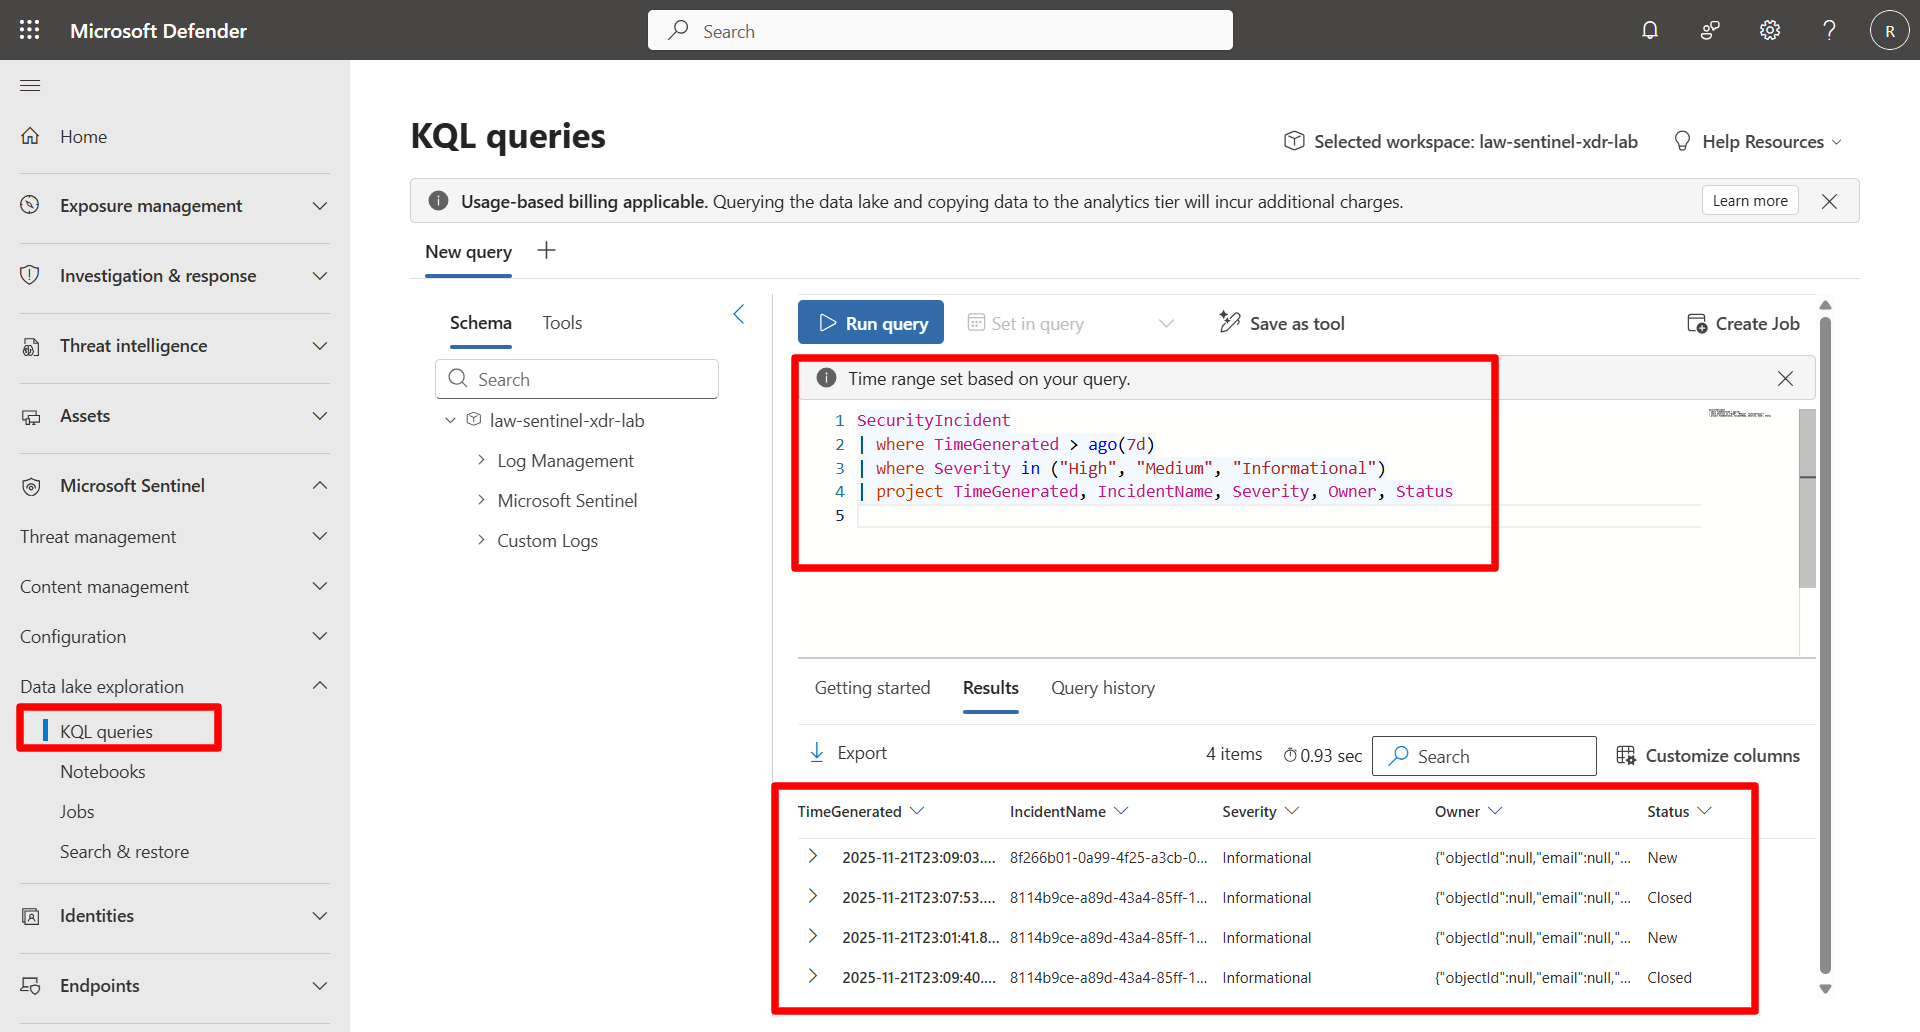
Benefits:
- Reduces data volume
- Improves readability
- Shortens query execution time
-
-
Use schema discovery before querying.
Expand here for detailed steps
When you are unsure about fields or when tables evolve, use
getschemato explore the structure.-
Run:
 SecurityIncident
 | getschema
Benefits:
- Confirms field names and types
- Prevents errors from missing or renamed columns
- Useful when working with Lake tables that change over time
-
-
For large data ranges, use summaries + KQL Jobs.
Expand here for detailed steps
Directly querying large historical datasets in the Lake (e.g., months or years of parquet files) is inefficient. A better pattern is to generate curated rollups and persist them using KQL Jobs.
Use this pattern for long-range analysis:
- Query large data volumes in the Lake
- Generate daily or hourly rollups
- Save results into an Analytics-tier table using a KQL Job
- Query the smaller “gold table” instead of rescanning raw telemetry
This pattern is used extensively in Exercise 7, where you build both one-off and scheduled KQL Jobs.
-
Run the optimized end-to-end example.
Expand here for detailed steps
This query demonstrates all optimization techniques together.
 SecurityIncident
 | where TimeGenerated > ago(7d)
 | where ProviderName == "Microsoft XDR"
 | where Severity in ("High", "Medium","Informational")
 | project TimeGenerated, IncidentName, Severity, Owner, Status
 | summarize TotalIncidents = count()
     by bin(TimeGenerated, 1d), Severity
 | order by TimeGenerated desc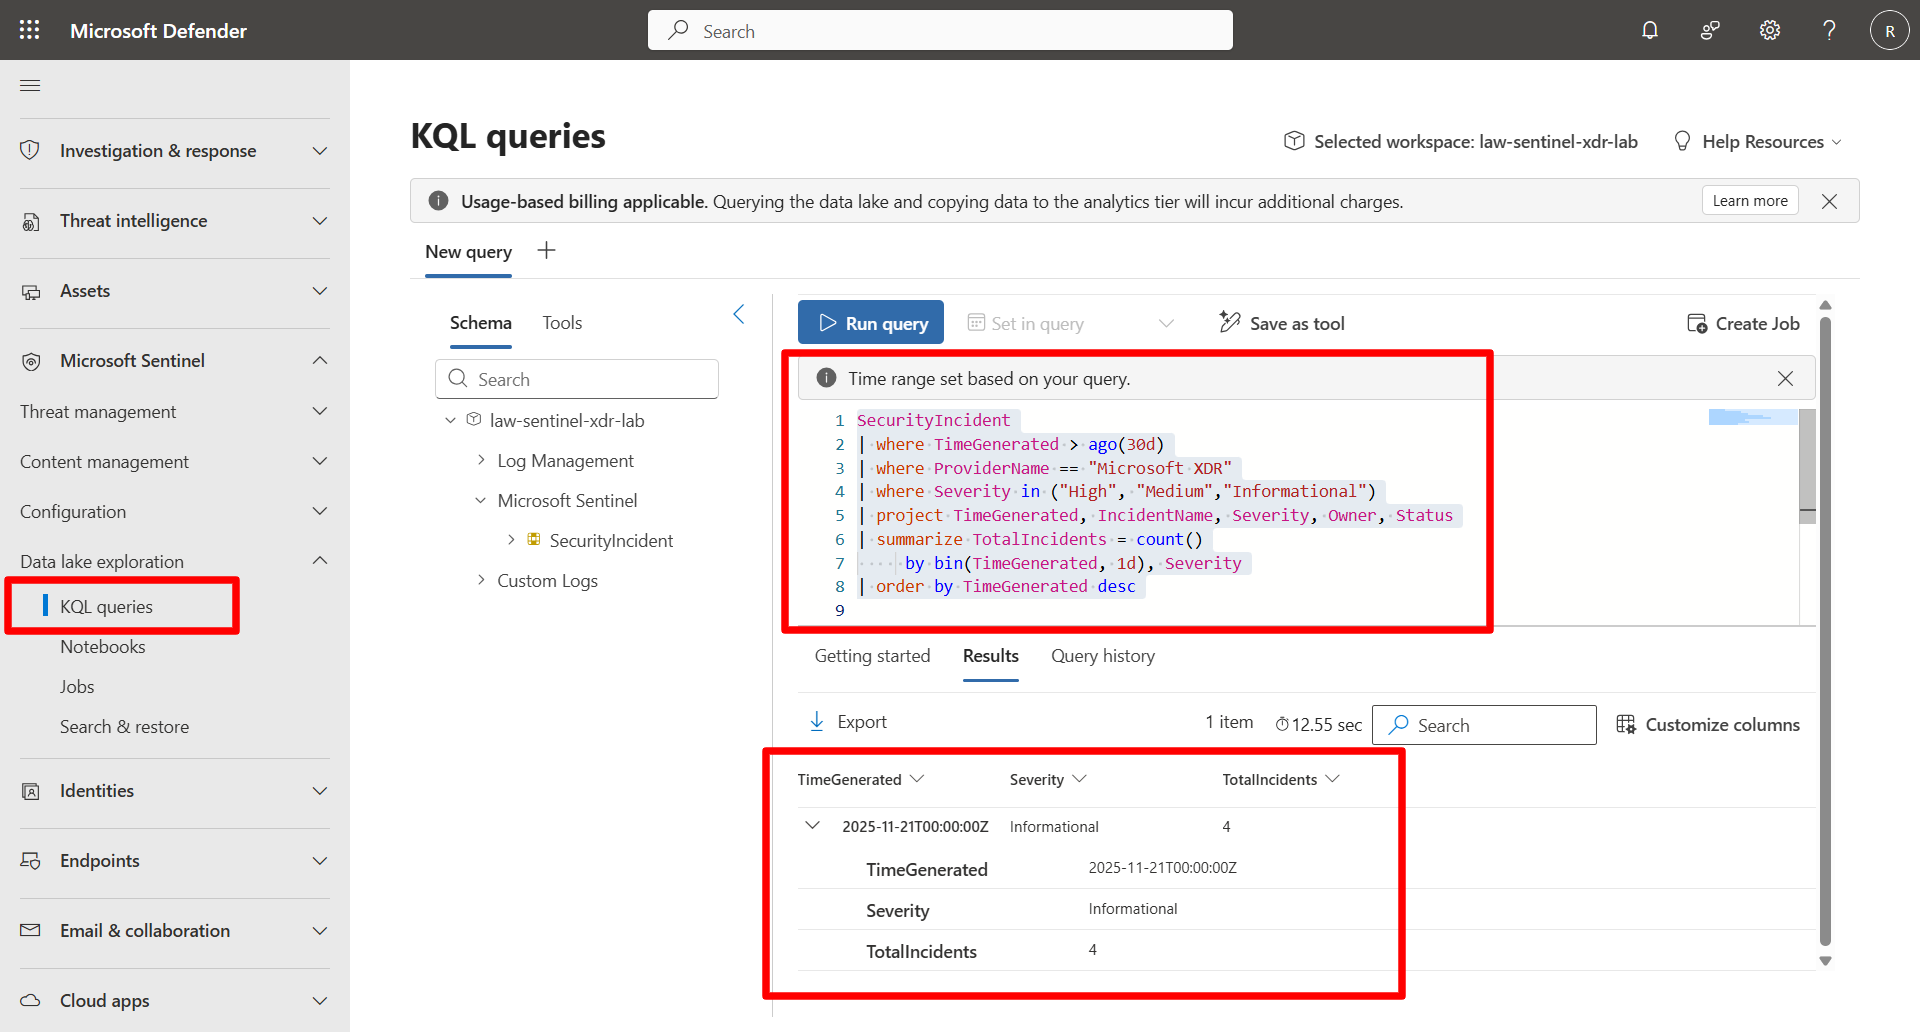
This reflects the best practices:
- Tight time range
- Early filtering
- Column projection
- Aggregation