Task 02: Explore the Entity Investigation Graph
Introduction
The Entity Investigation Graph helps visualize all entities, alerts, and relationships associated with a specific incident in Defender XDR.
Description
You’ll analyze the EICAR test alert triggered from your Azure VM to review related entities and attack paths using the built-in investigation graph.
Success criteria
-
The EICAR_Test_File malware was prevented incident is visible.
-
Related entities appear in the investigation graph.
-
You understand how Defender XDR automatically correlates evidence and relationships.
Key steps:
-
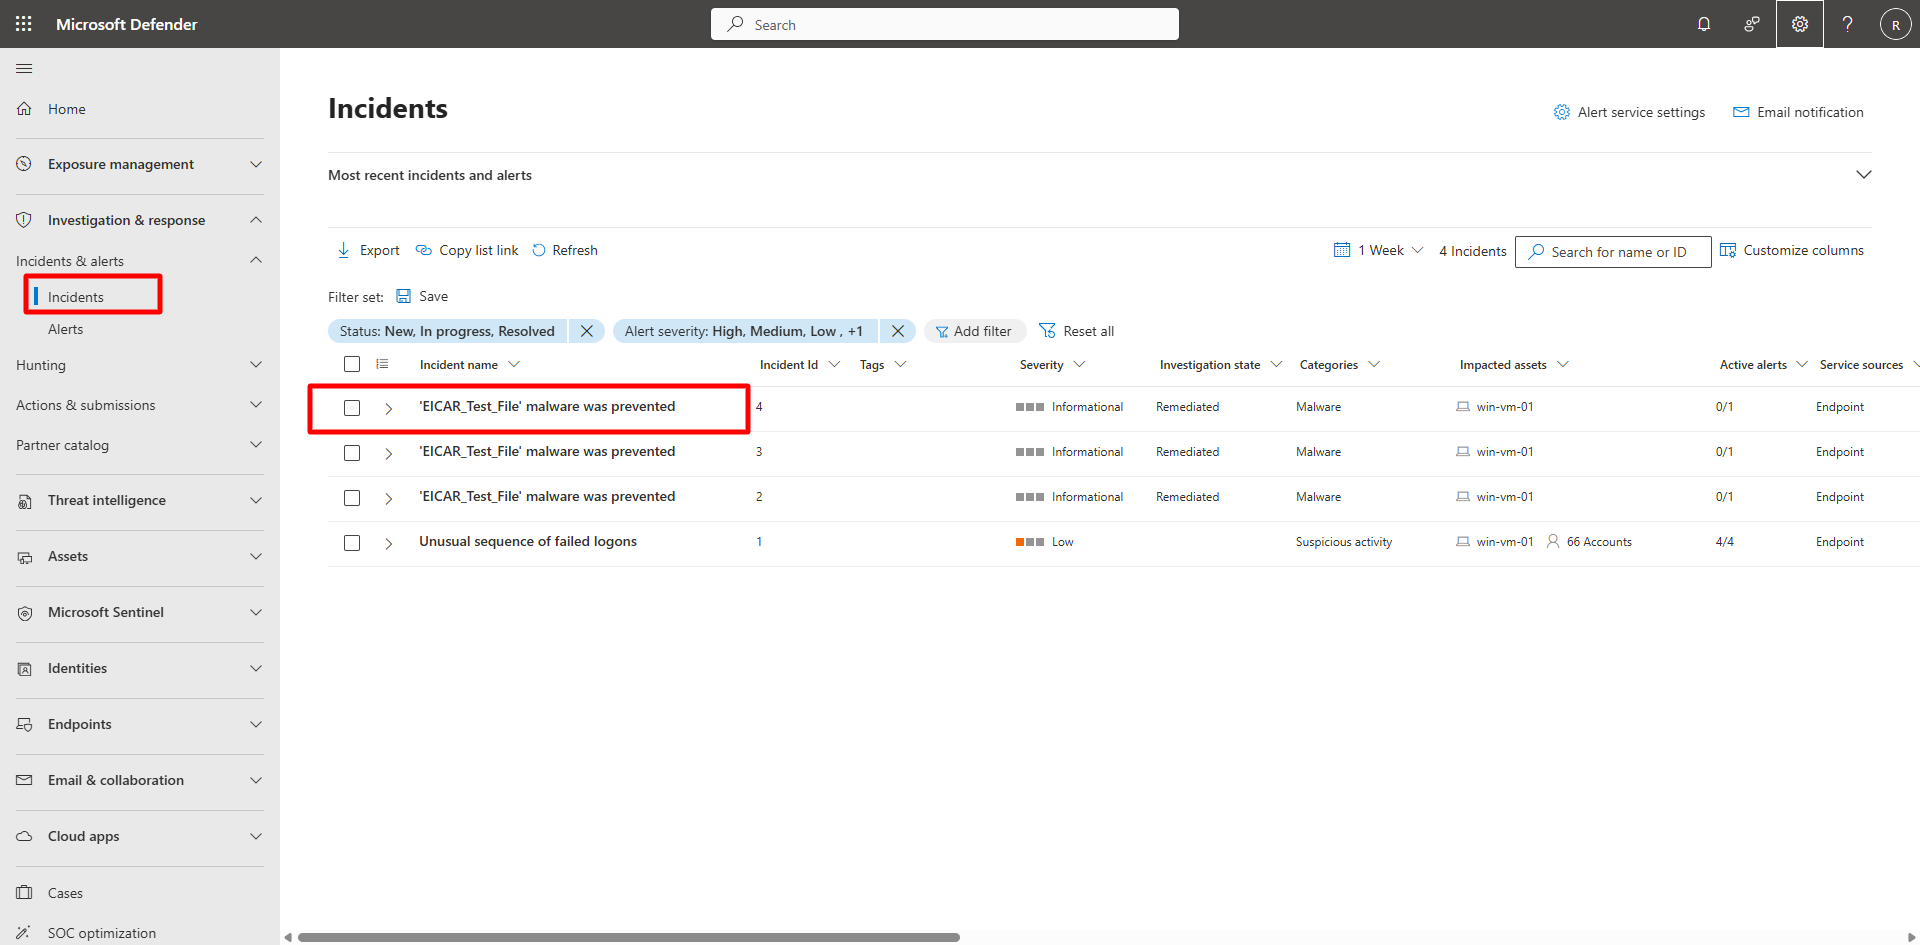
Locate the EICAR incident.
Expand here for detailed steps
- In the Defender portal, go to Investigation & response > Incidents & Alerts > Incidents.
- Apply filters:
- Status: New, In progress, Resolved
- Alert severity: High, Medium, Low, Informational
- Locate the incident titled EICAR_Test_File malware was prevented.
- Confirm:
- Category: Malware
- Impacted asset: Your test VM (for example,
win-vm-01).
-
Investigate incident details.
Expand here for detailed steps
-
Select the EICAR_Test_File incident.
-
Review the incident details page— the Incident graph appears in the center panel.
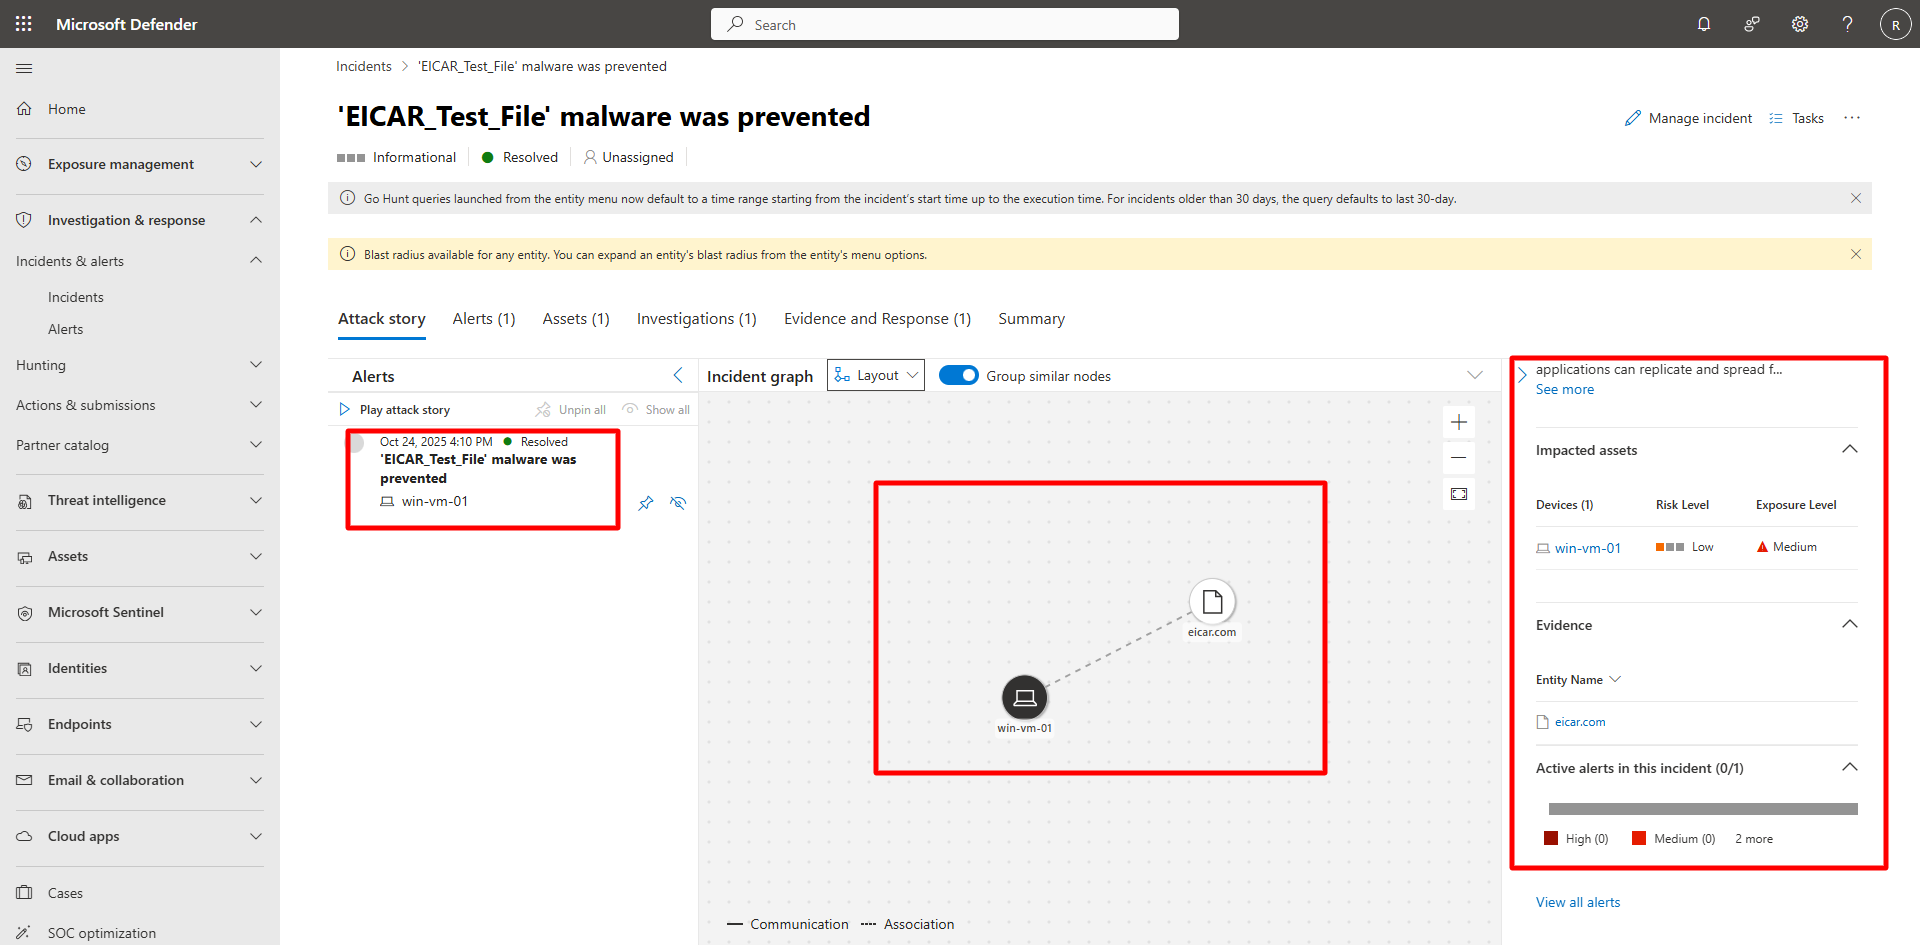
-
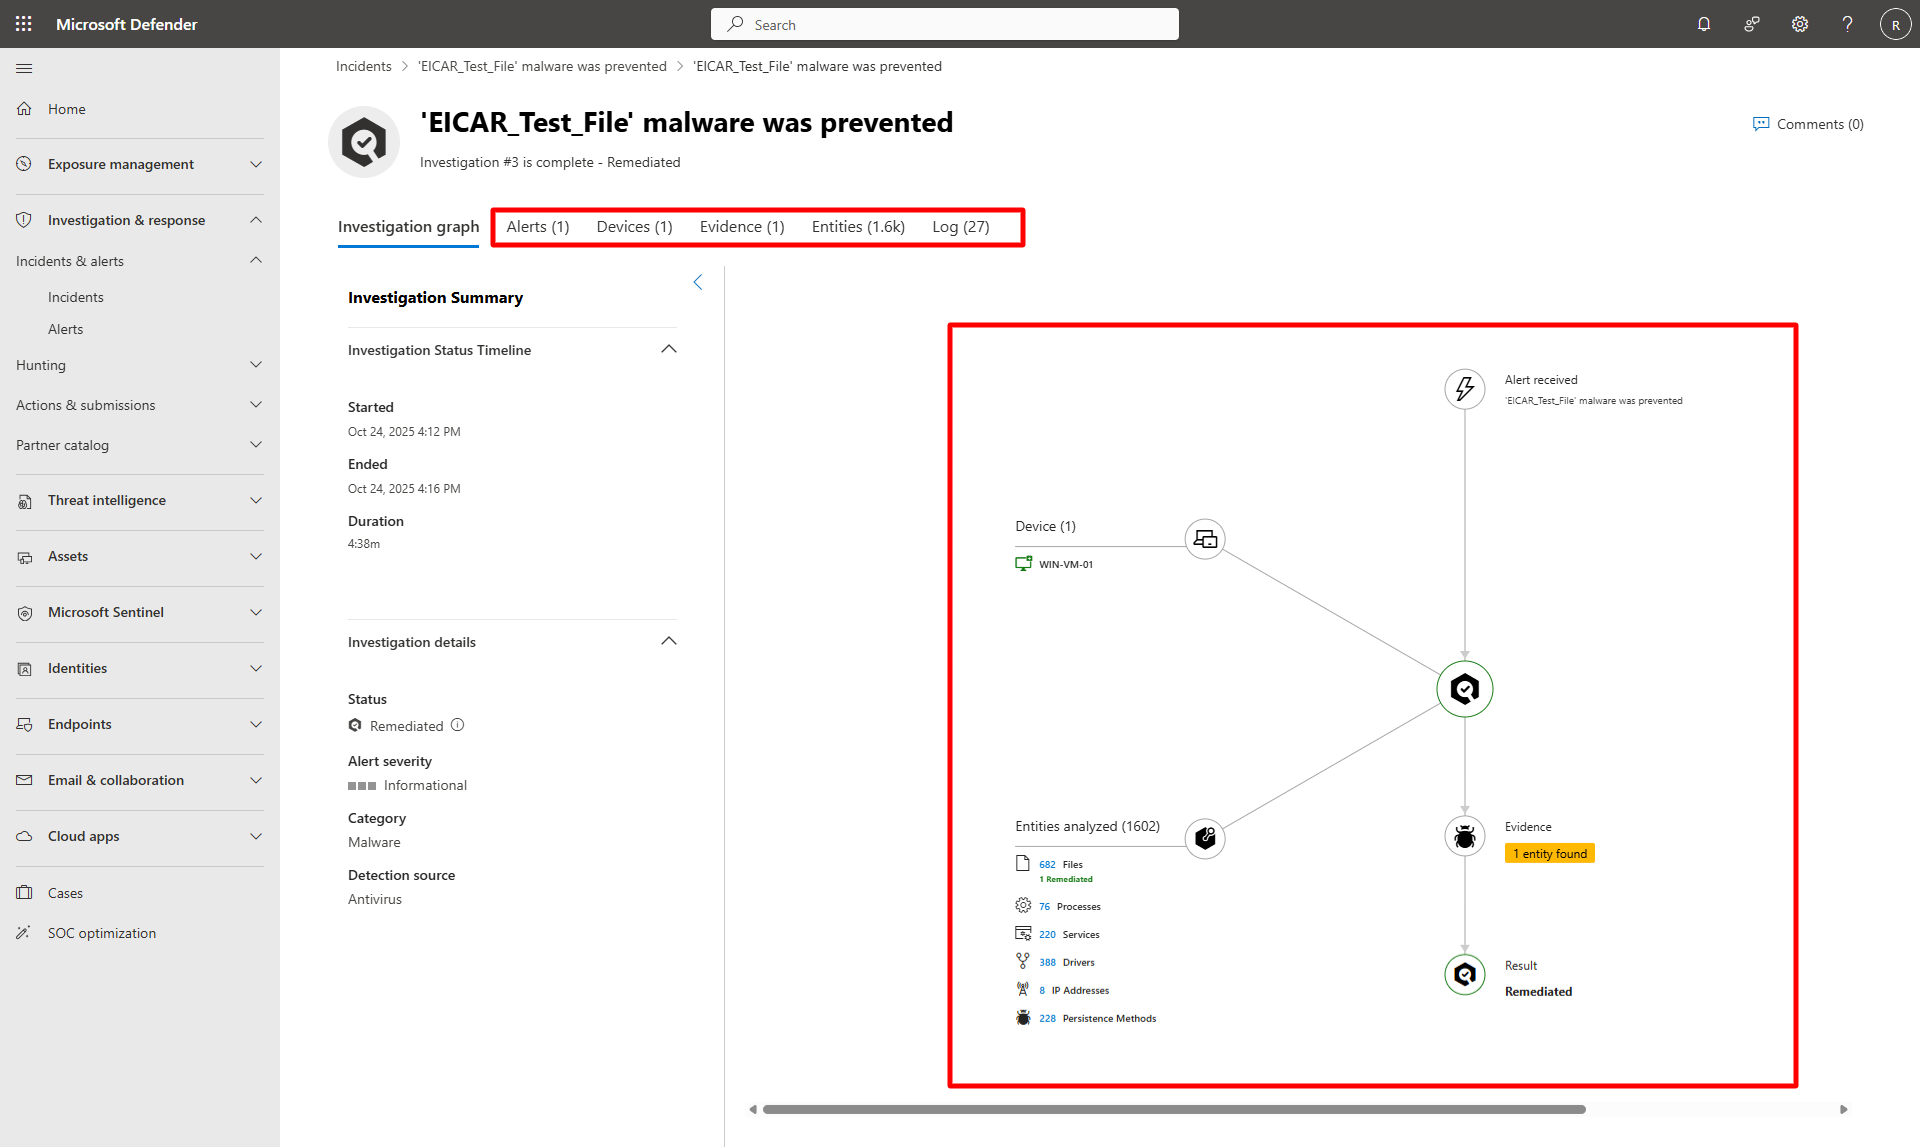
Open the Investigations tab and select the triggering alert to view the Investigation graph.
-
Explore the Evidence, Entities, and Logs tabs for correlated artifacts and automated analysis results.
-