Task 01: Use hunting graph visualization
Introduction
The graph visualization feature in Microsoft Defender XDR reveals relationships between users, devices, and IPs. It helps analysts uncover lateral movement, correlated alerts, and entity dependencies.
Description
You’ll open the hunting graph tool, load a scenario, and interactively explore how different entities connect through logon, process, and network relationships.
Success criteria
- The Paths between two entities graph renders successfully.
- Entity nodes and relationships display with proper labels.
- The analyst identifies at least one potential lateral movement path.
Key steps:
-
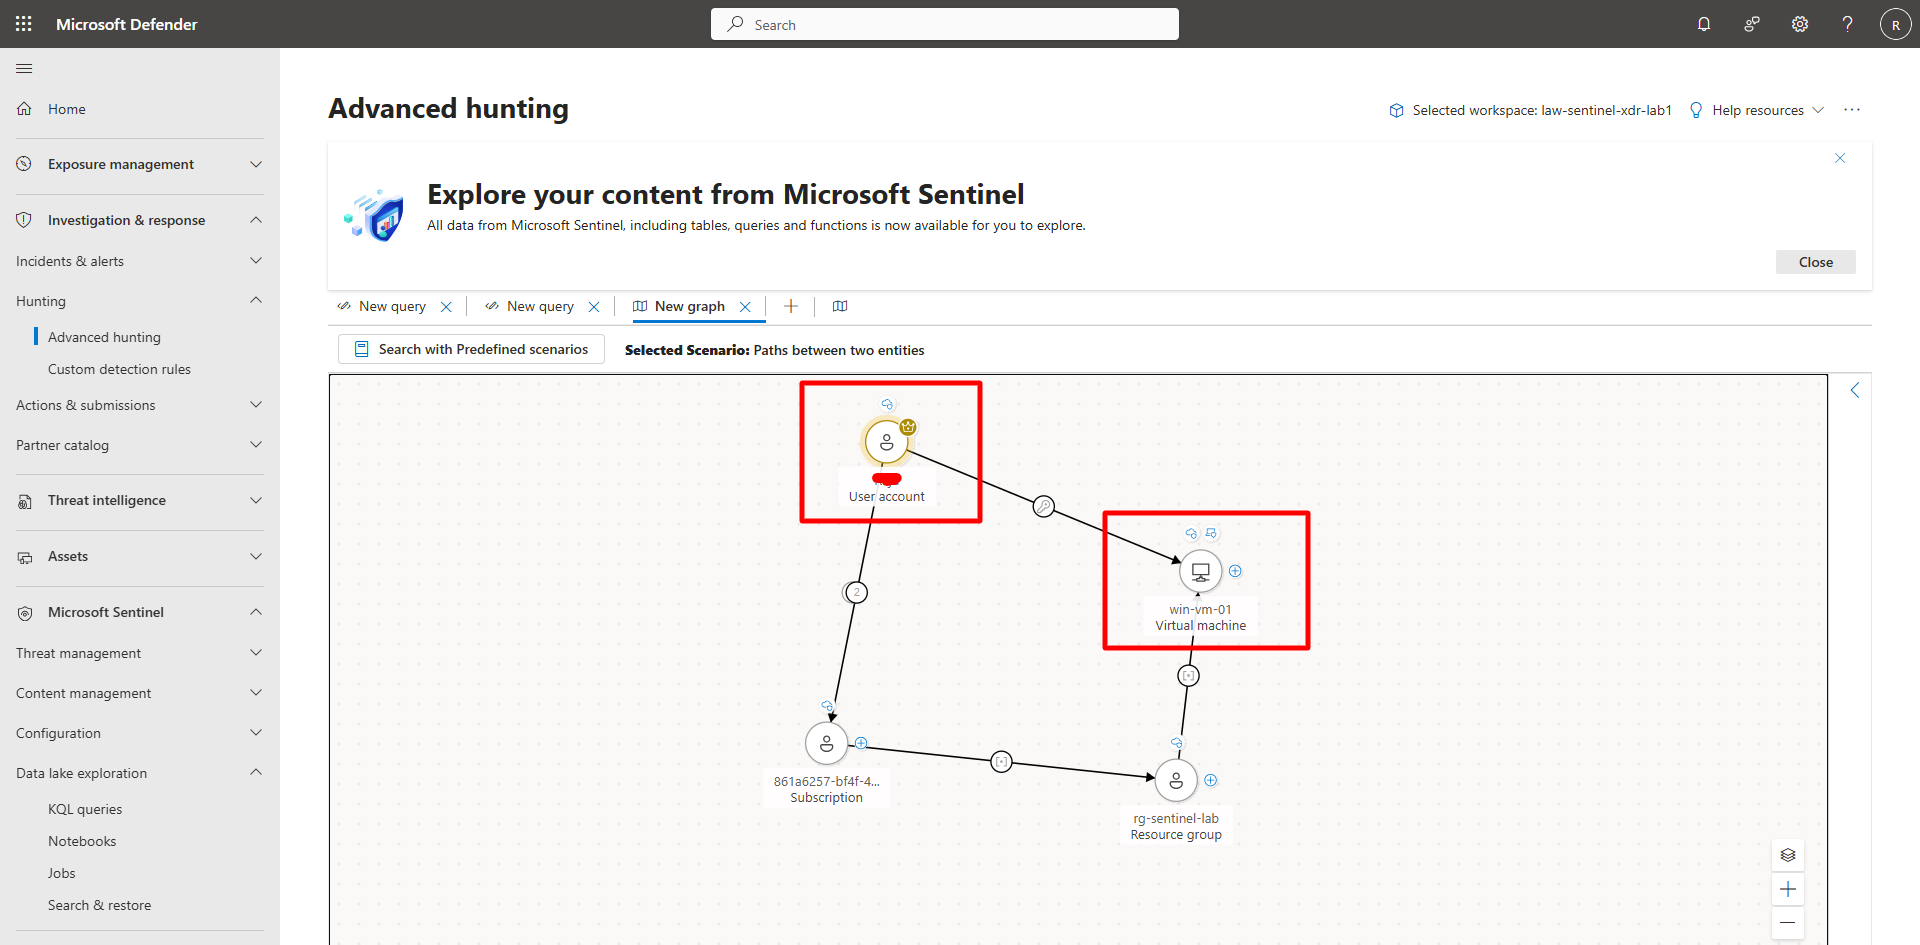
Open the graph visualization tool and select the Render graph predefined scenario.
Expand here for detailed steps
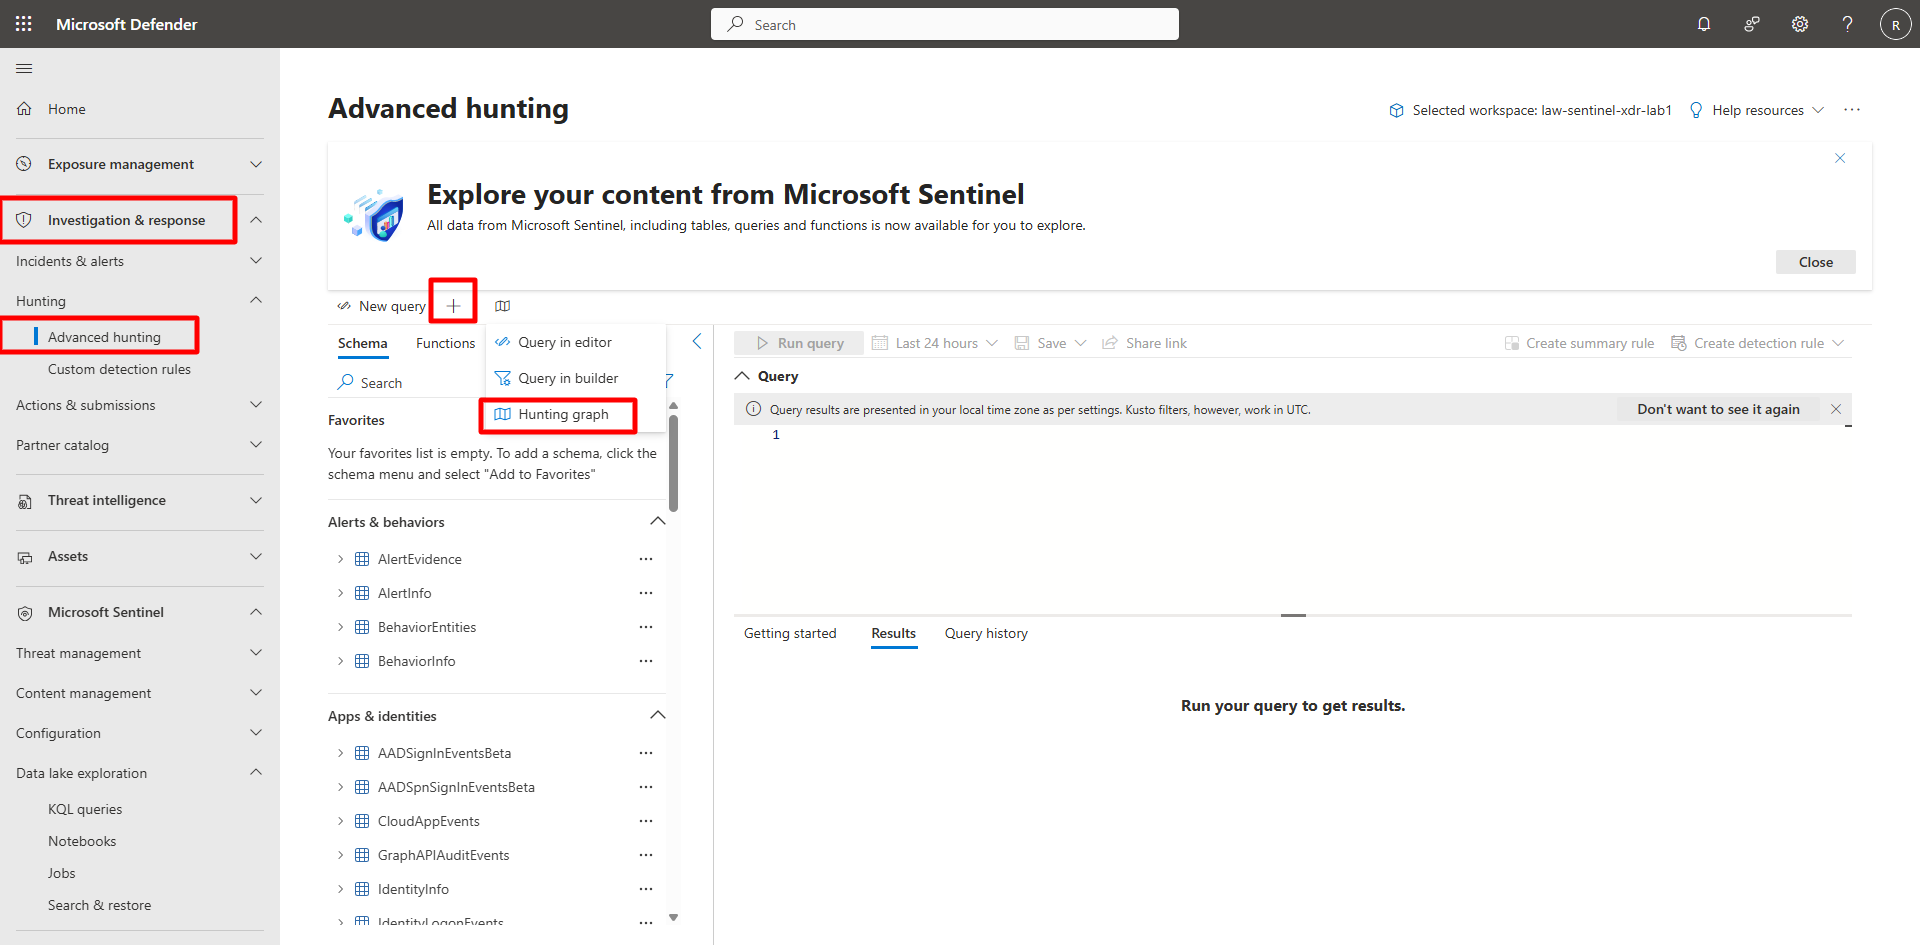
- In the Defender portal, go to Investigation & response > Hunting > Advanced hunting.
- On the menu, select the +, then select Hunting graph.
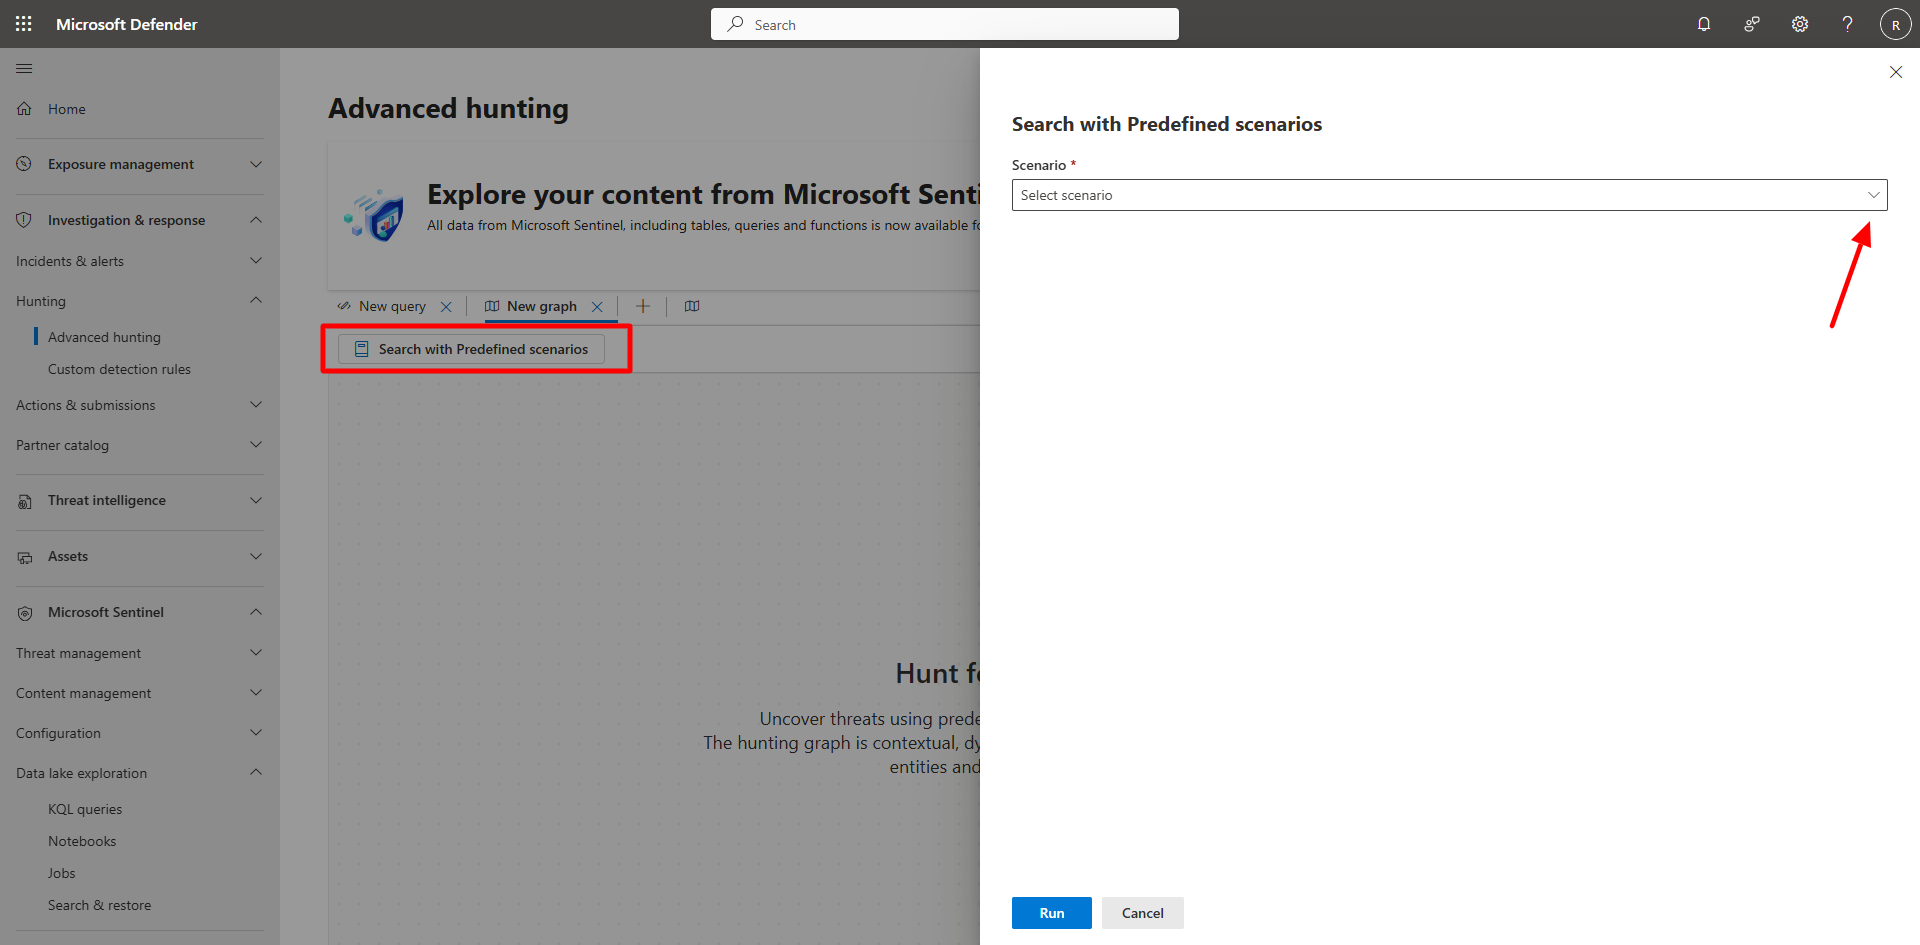
- Select Search with Predefined scenarios.
-
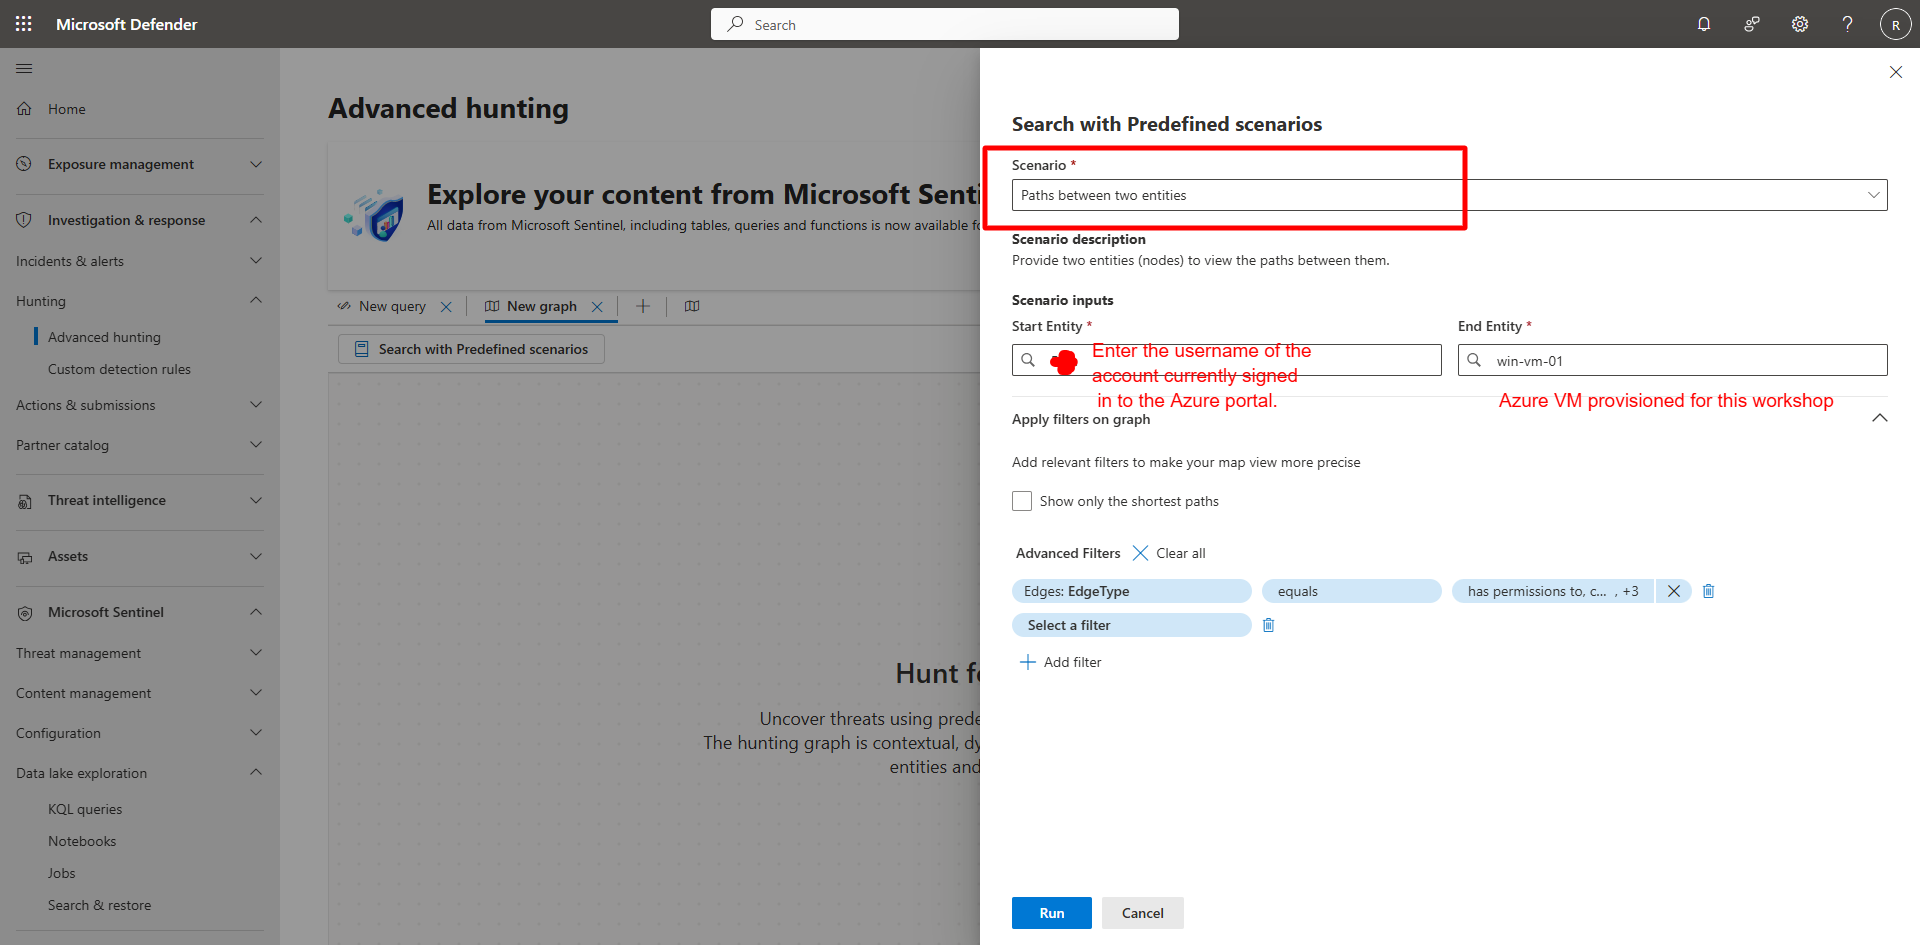
Enter the following and select Run:
Item Value Scenario Paths between two entitiesStart Entity Current Azure account you are signed in withEnd Entity vm-sentinel-lab
-
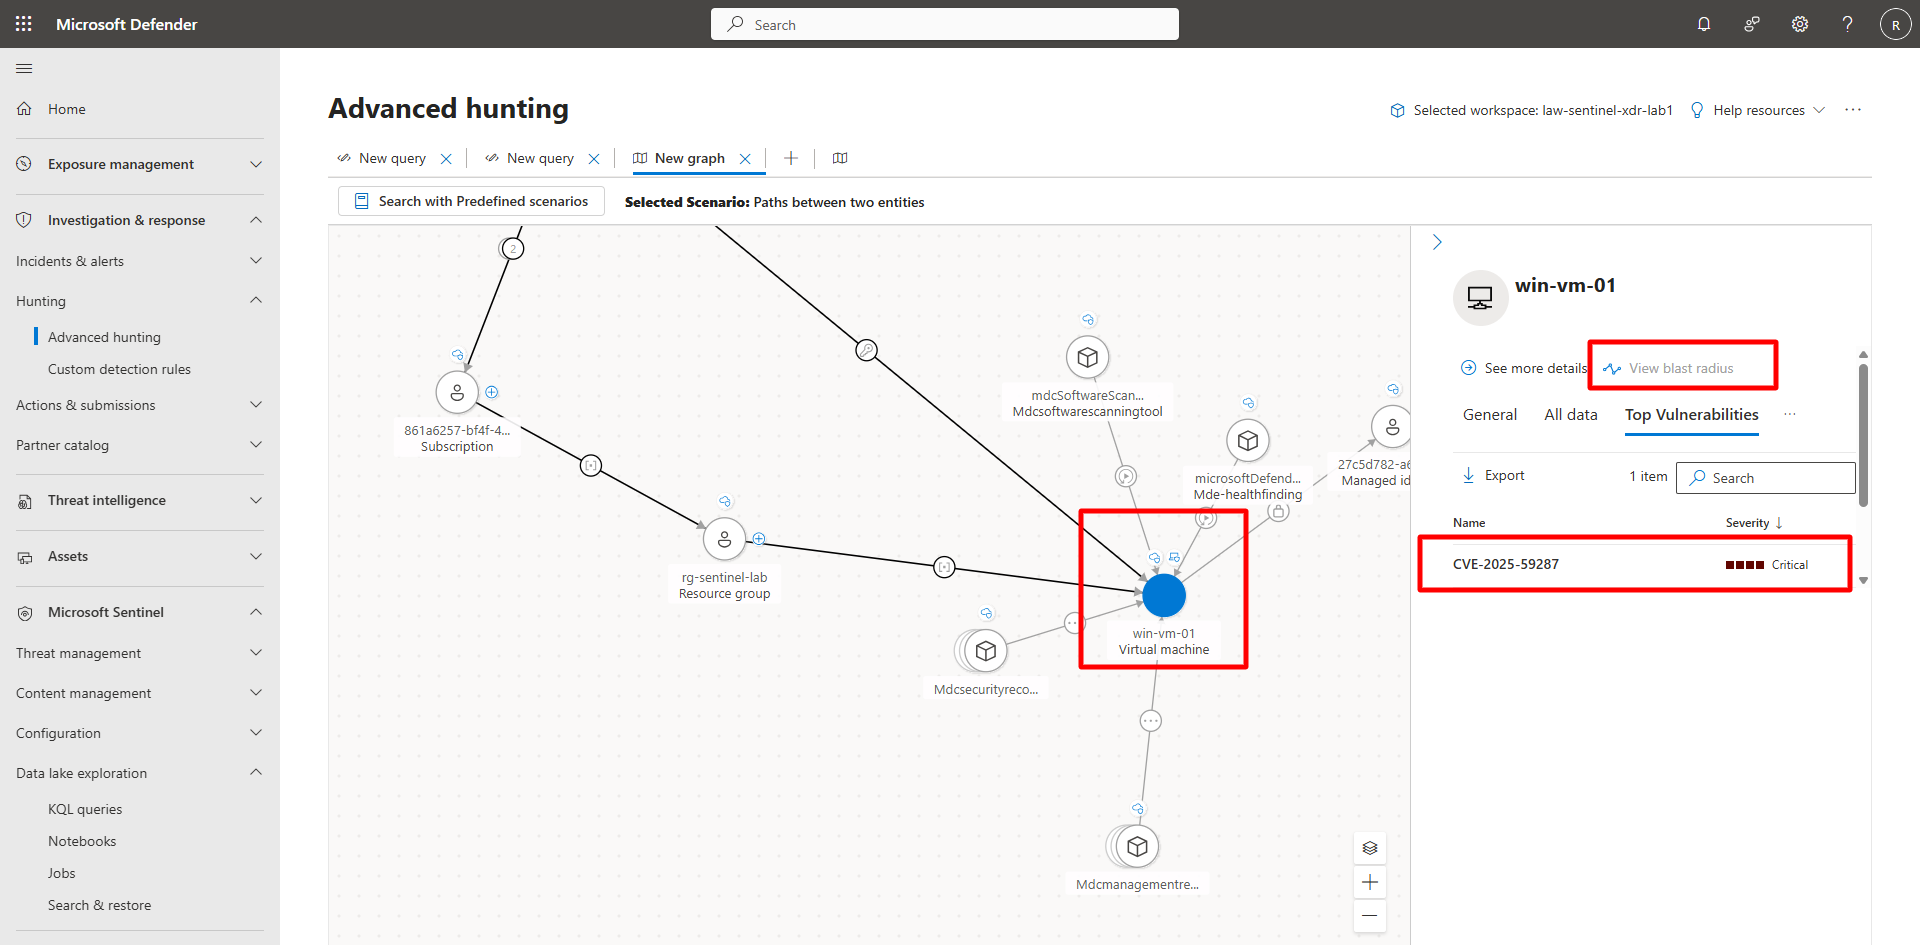
Explore the graph.
-
Nodes represent entities such as users, devices, and IP addresses.
-
Edges represent relationships like logons, processes, or network connections.
-
Use zoom and pan controls to navigate the graph, and expand nodes for detailed context.
-
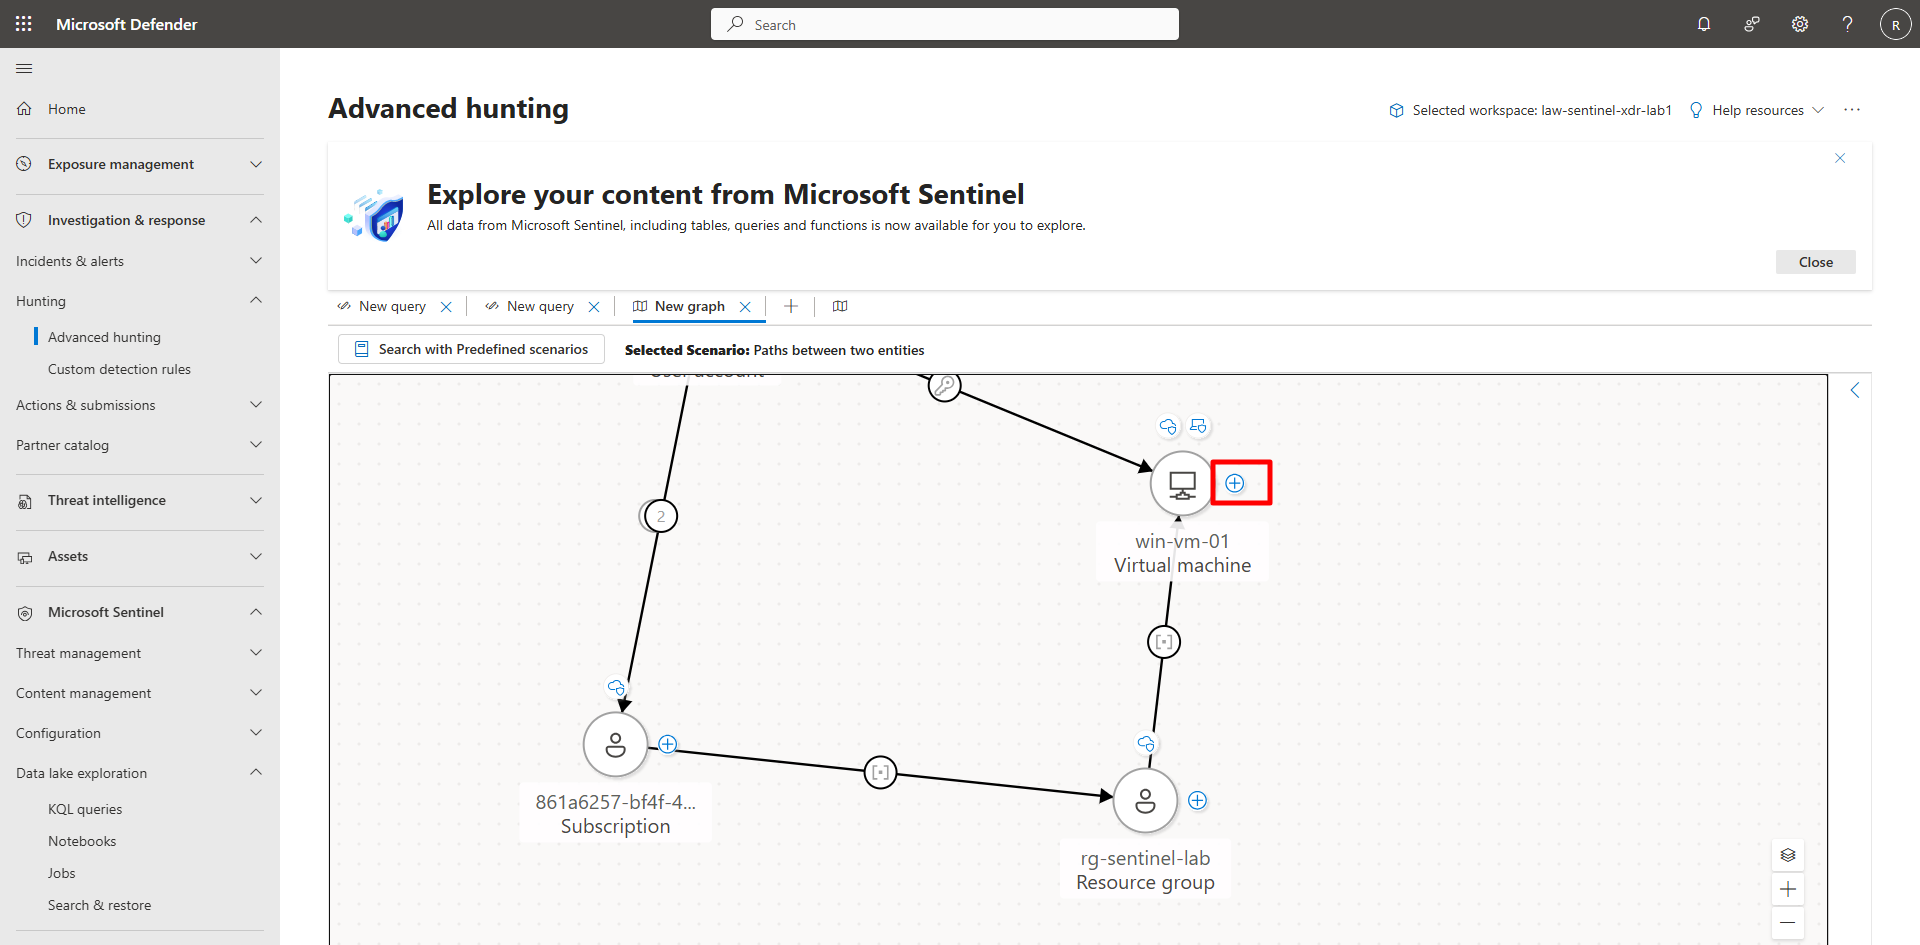
Use the graph to visualize blast radius and lateral movement potential—how compromise of one device could spread to others.