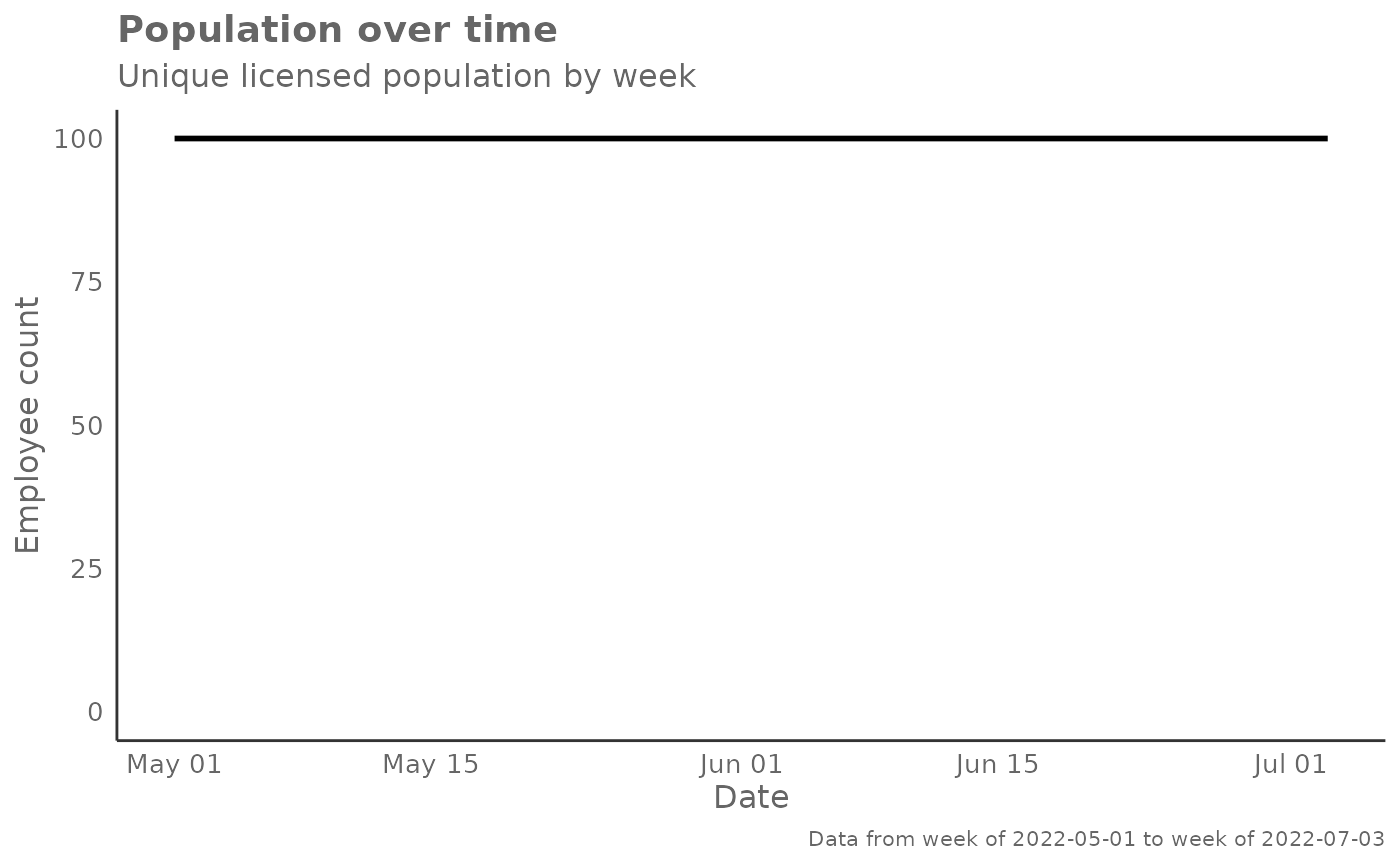
Returns a line chart showing the change in employee count over time. Part of a data validation process to check for unusual license growth / declines over time.
Arguments
- data
A Standard Person Query dataset in the form of a data frame. This must be a panel dataset where each row represents one employee per time period, with the columns
PersonIdandMetricDatepresent.- return
String specifying what to return. This must be one of the following strings:
"plot""table"
See
Valuefor more information.
Value
A different output is returned depending on the value passed to the return
argument:
"plot": ggplot object. A line plot showing employee count over time."table": data frame containing a summary table.
See also
Other Visualization:
afterhours_dist(),
afterhours_fizz(),
afterhours_line(),
afterhours_rank(),
afterhours_summary(),
afterhours_trend(),
collaboration_area(),
collaboration_dist(),
collaboration_fizz(),
collaboration_line(),
collaboration_rank(),
collaboration_sum(),
collaboration_trend(),
create_bar(),
create_bar_asis(),
create_boxplot(),
create_bubble(),
create_dist(),
create_fizz(),
create_inc(),
create_line(),
create_line_asis(),
create_period_scatter(),
create_radar(),
create_rank(),
create_rogers(),
create_sankey(),
create_scatter(),
create_stacked(),
create_survival(),
create_tracking(),
create_trend(),
email_dist(),
email_fizz(),
email_line(),
email_rank(),
email_summary(),
email_trend(),
external_dist(),
external_fizz(),
external_line(),
external_rank(),
external_sum(),
hrvar_count(),
hrvar_trend(),
keymetrics_scan(),
meeting_dist(),
meeting_fizz(),
meeting_line(),
meeting_rank(),
meeting_summary(),
meeting_trend(),
one2one_dist(),
one2one_fizz(),
one2one_freq(),
one2one_line(),
one2one_rank(),
one2one_sum(),
one2one_trend()
Other Data Validation:
check_query(),
extract_hr(),
flag_ch_ratio(),
flag_em_ratio(),
flag_extreme(),
flag_outlooktime(),
hrvar_count(),
hrvar_count_all(),
hrvar_trend(),
identify_churn(),
identify_holidayweeks(),
identify_inactiveweeks(),
identify_nkw(),
identify_outlier(),
identify_privacythreshold(),
identify_shifts(),
identify_tenure(),
track_HR_change(),
validation_report()
Examples
# Return plot
hr_trend(pq_data)


# Return summary table
hr_trend(pq_data, return = "table")
#> # A tibble: 23 × 2
#>    Date           n
#>    <date>     <int>
#>  1 2024-04-28   300
#>  2 2024-05-05   300
#>  3 2024-05-12   300
#>  4 2024-05-19   300
#>  5 2024-05-26   300
#>  6 2024-06-02   300
#>  7 2024-06-09   300
#>  8 2024-06-16   300
#>  9 2024-06-23   300
#> 10 2024-06-30   300
#> # ℹ 13 more rows
# Return summary table
hr_trend(pq_data, return = "table")
#> # A tibble: 23 × 2
#> Date n
#> <date> <int>
#> 1 2024-04-28 300
#> 2 2024-05-05 300
#> 3 2024-05-12 300
#> 4 2024-05-19 300
#> 5 2024-05-26 300
#> 6 2024-06-02 300
#> 7 2024-06-09 300
#> 8 2024-06-16 300
#> 9 2024-06-23 300
#> 10 2024-06-30 300
#> # ℹ 13 more rows