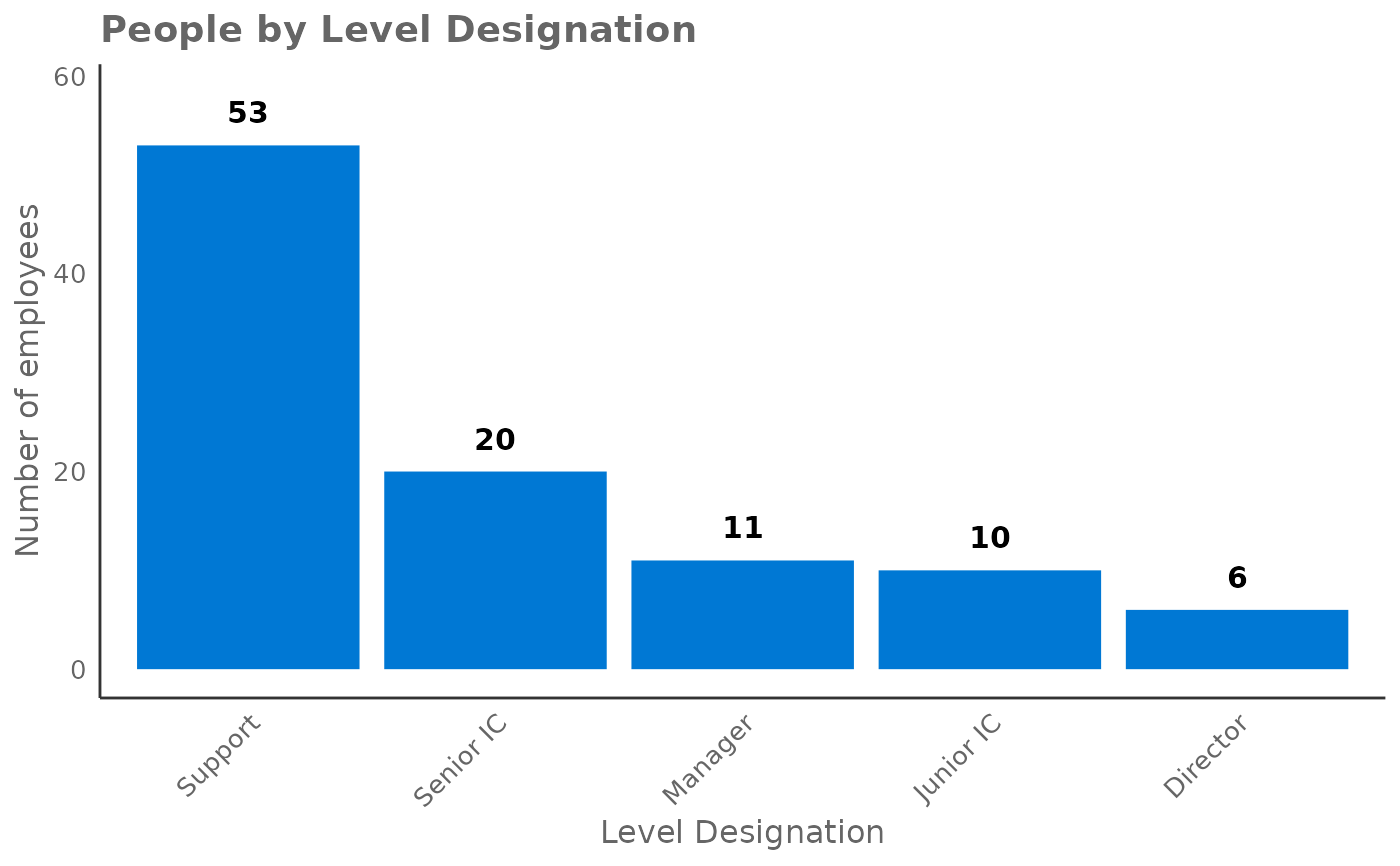
This function enables you to create a count of the distinct people by the specified HR attribute.The default behaviour is to return a bar chart as typically seen in 'Analysis Scope'.
Usage
hrvar_count(data, hrvar = "Organization", return = "plot")

analysis_scope(data, hrvar = "Organization", return = "plot")
Arguments
- data
A Standard Person Query dataset in the form of a data frame. This must be a panel dataset where each row represents one employee per time period, with the columns
PersonIdandMetricDatepresent.- hrvar
HR Variable by which to split metrics, defaults to "Organization" but accepts any character vector, e.g. "LevelDesignation". If a vector with more than one value is provided, the HR attributes are automatically concatenated.
- return
String specifying what to return. This must be one of the following strings:
"plot""table"
See
Valuefor more information.
Value
A different output is returned depending on the value passed to the return
argument:
"plot": 'ggplot' object containing a bar plot."table": data frame containing a count table.
See also
Other Visualization:
afterhours_dist(),
afterhours_fizz(),
afterhours_line(),
afterhours_rank(),
afterhours_summary(),
afterhours_trend(),
collaboration_area(),
collaboration_dist(),
collaboration_fizz(),
collaboration_line(),
collaboration_rank(),
collaboration_sum(),
collaboration_trend(),
create_bar(),
create_bar_asis(),
create_boxplot(),
create_bubble(),
create_dist(),
create_fizz(),
create_inc(),
create_line(),
create_line_asis(),
create_period_scatter(),
create_radar(),
create_rank(),
create_rogers(),
create_sankey(),
create_scatter(),
create_stacked(),
create_survival(),
create_tracking(),
create_trend(),
email_dist(),
email_fizz(),
email_line(),
email_rank(),
email_summary(),
email_trend(),
external_dist(),
external_fizz(),
external_line(),
external_rank(),
external_sum(),
hr_trend(),
hrvar_trend(),
keymetrics_scan(),
meeting_dist(),
meeting_fizz(),
meeting_line(),
meeting_rank(),
meeting_summary(),
meeting_trend(),
one2one_dist(),
one2one_fizz(),
one2one_freq(),
one2one_line(),
one2one_rank(),
one2one_sum(),
one2one_trend()
Other Data Validation:
check_query(),
extract_hr(),
flag_ch_ratio(),
flag_em_ratio(),
flag_extreme(),
flag_outlooktime(),
hr_trend(),
hrvar_count_all(),
hrvar_trend(),
identify_churn(),
identify_holidayweeks(),
identify_inactiveweeks(),
identify_nkw(),
identify_outlier(),
identify_privacythreshold(),
identify_shifts(),
identify_tenure(),
track_HR_change(),
validation_report()
Examples
# Return a bar plot
hrvar_count(pq_data, hrvar = "LevelDesignation")


# Return a summary table
hrvar_count(pq_data, hrvar = "LevelDesignation", return = "table")
#> # A tibble: 4 × 2
#>   LevelDesignation     n
#>   <chr>            <int>
#> 1 Junior IC          136
#> 2 Senior IC           87
#> 3 Senior Manager      40
#> 4 Executive           37
# Return a summary table
hrvar_count(pq_data, hrvar = "LevelDesignation", return = "table")
#> # A tibble: 4 × 2
#> LevelDesignation n
#> <chr> <int>
#> 1 Junior IC 136
#> 2 Senior IC 87
#> 3 Senior Manager 40
#> 4 Executive 37