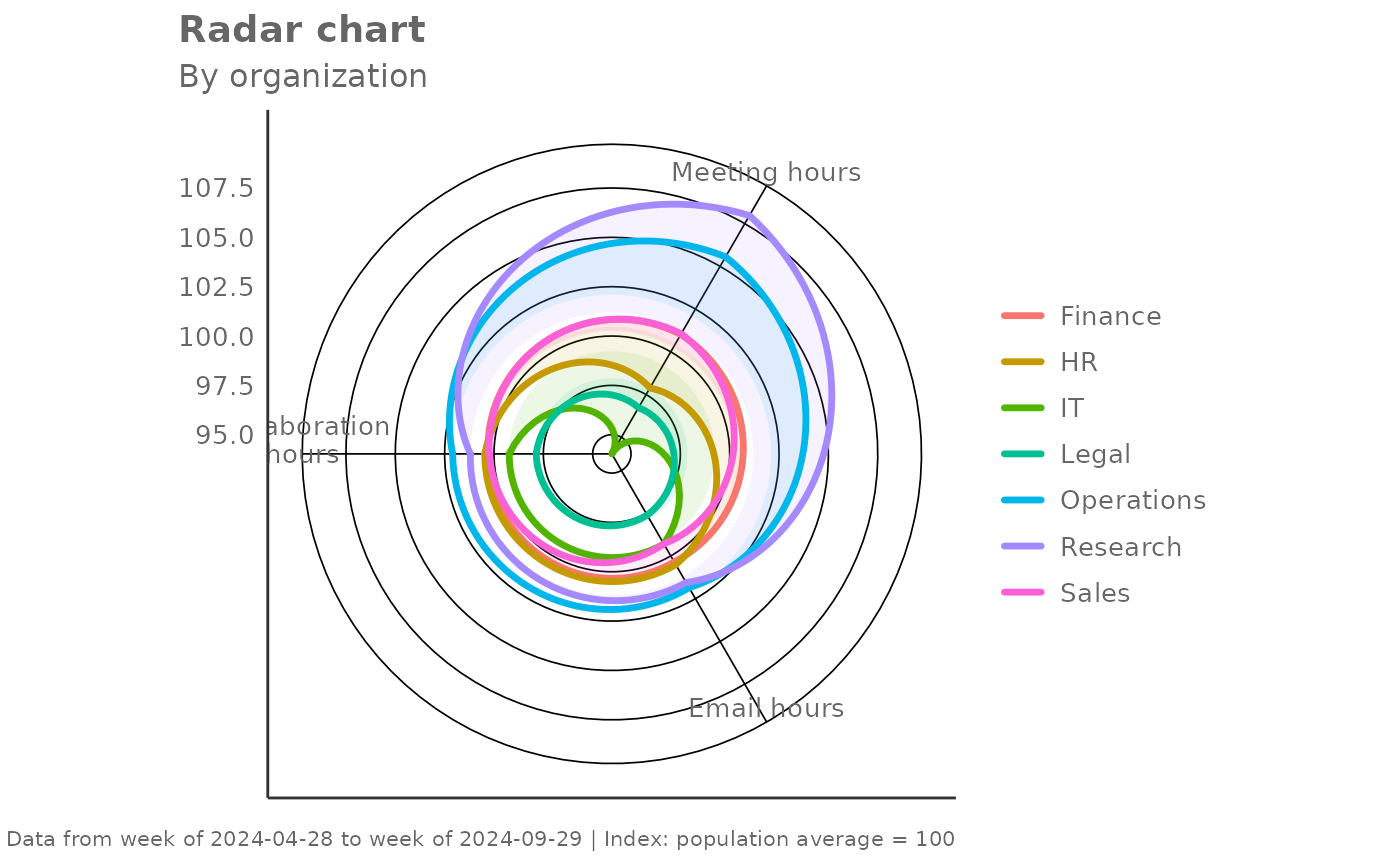
Creates a multi-group radar (spider) chart across a set of metrics.
Core pipeline:
Person-level aggregation within group
Group-level aggregation
Privacy filtering via
mingroupOptional indexing modes: "total", "none", "ref_group", "minmax"
Optional auto-segmentation:
If
hrvaris not supplied, the function will callidentify_usage_segments()and infer the resulting segment column.
Usage
create_radar(
  data,
  metrics,
  hrvar = "Organization",
  mingroup = 5,
  agg = "mean",
  index_mode = "total",
  index_ref_group = NULL,
  na.rm = FALSE,
  return = "plot"
)
Arguments
- data
A Standard Person Query dataset in the form of a data frame.
- metrics
Character vector of metric column names.
- hrvar
Character string specifying the grouping column. Defaults to
"Organization". IfNULL, usage segments will be derived viaidentify_usage_segments().- mingroup
Numeric value setting the privacy threshold / minimum group size. Defaults to 5.
- agg
String specifying aggregation method. Either
"mean"(default) or"median".- index_mode
String specifying indexing mode. One of:
"total"(default): Total = 100 for each metric"none": no indexing (raw group values)"ref_group": reference group = 100 (requiresindex_ref_group)"minmax": scale to [0, 100] within observed group ranges per metric
- index_ref_group
Character string specifying reference group name when
index_mode = "ref_group".- na.rm
Logical value indicating whether NA rows in required columns are removed prior to aggregation. Defaults to
FALSE.- return
String specifying what to return. One of:
"plot"(default)"table"
Value
A different output is returned depending on the value passed to return:
"plot": ggplot object (radar chart)"table": data frame (group-level indexed table)
See also
Other Visualization:
afterhours_dist(),
afterhours_fizz(),
afterhours_line(),
afterhours_rank(),
afterhours_summary(),
afterhours_trend(),
collaboration_area(),
collaboration_dist(),
collaboration_fizz(),
collaboration_line(),
collaboration_rank(),
collaboration_sum(),
collaboration_trend(),
create_bar(),
create_bar_asis(),
create_boxplot(),
create_bubble(),
create_dist(),
create_fizz(),
create_inc(),
create_line(),
create_line_asis(),
create_period_scatter(),
create_rank(),
create_rogers(),
create_sankey(),
create_scatter(),
create_stacked(),
create_survival(),
create_tracking(),
create_trend(),
email_dist(),
email_fizz(),
email_line(),
email_rank(),
email_summary(),
email_trend(),
external_dist(),
external_fizz(),
external_line(),
external_rank(),
external_sum(),
hr_trend(),
hrvar_count(),
hrvar_trend(),
keymetrics_scan(),
meeting_dist(),
meeting_fizz(),
meeting_line(),
meeting_rank(),
meeting_summary(),
meeting_trend(),
one2one_dist(),
one2one_fizz(),
one2one_freq(),
one2one_line(),
one2one_rank(),
one2one_sum(),
one2one_trend()
Other Flexible:
create_bar(),
create_bar_asis(),
create_boxplot(),
create_bubble(),
create_density(),
create_dist(),
create_fizz(),
create_hist(),
create_inc(),
create_line(),
create_line_asis(),
create_period_scatter(),
create_rank(),
create_sankey(),
create_scatter(),
create_stacked(),
create_survival(),
create_tracking(),
create_trend()
Examples
create_radar(
  data = pq_data,
  metrics = c("Collaboration_hours", "Email_hours", "Meeting_hours"),
  hrvar = "Organization",
  mingroup = 1
)


# Return the indexed table instead of a plot
create_radar(
  data = pq_data,
  metrics = c("Collaboration_hours", "Email_hours", "Meeting_hours"),
  hrvar = "LevelDesignation",
  mingroup = 1,
  return = "table"
)
#> # A tibble: 4 × 5
#>   LevelDesignation Collaboration_hours Email_hours Meeting_hours     n
#>   <chr>                          <dbl>       <dbl>         <dbl> <int>
#> 1 Executive                      101.        101.           98.6    37
#> 2 Junior IC                       99.7        99.5          97.5   136
#> 3 Senior IC                      100.        101.          103.     87
#> 4 Senior Manager                  99.1        99.4         102.     40
# Return the indexed table instead of a plot
create_radar(
data = pq_data,
metrics = c("Collaboration_hours", "Email_hours", "Meeting_hours"),
hrvar = "LevelDesignation",
mingroup = 1,
return = "table"
)
#> # A tibble: 4 × 5
#> LevelDesignation Collaboration_hours Email_hours Meeting_hours n
#> <chr> <dbl> <dbl> <dbl> <int>
#> 1 Executive 101. 101. 98.6 37
#> 2 Junior IC 99.7 99.5 97.5 136
#> 3 Senior IC 100. 101. 103. 87
#> 4 Senior Manager 99.1 99.4 102. 40