
TIP
💡 Learn more : Azure Cosmos DB (opens new window).
# Performance Testing on Cosmos DB
Although Cosmos DB (opens new window) comes with global availability and guaranteed performance, it's still incumbent on the developer and architect to understand the implication of application and database design choices on performance. Central to the discussion of performance in Cosmos DB is the concept of a request unit (RU) (opens new window), which is canonically defined as the processing capacity (CPU, memory, and IOPS) to perform a GET (retrieve) on a 1-KB document with 10 properties. Requests to delete, insert, or update require more capacity and so result in a higher RU cost. For instance, an insert of that same 1-KB document would incur a cost of 5 RUs.
RUs are also the currency of scale in Cosmos DB and, given that the RU cost of a single operation is deterministic, it is possible to estimate the cost of anticipated operations as well as to monitor the actual cost of completed operations. Armed with this information, you will be able to better assess the performance and scalability of your data architecture from planning to implementation to monitoring the production system.
# Capacity Planning
In the planning stages, you can make use of the capacity planner (opens new window) to provide a rough estimate of required RUs given your sample document profile and the expected number of operations per second.
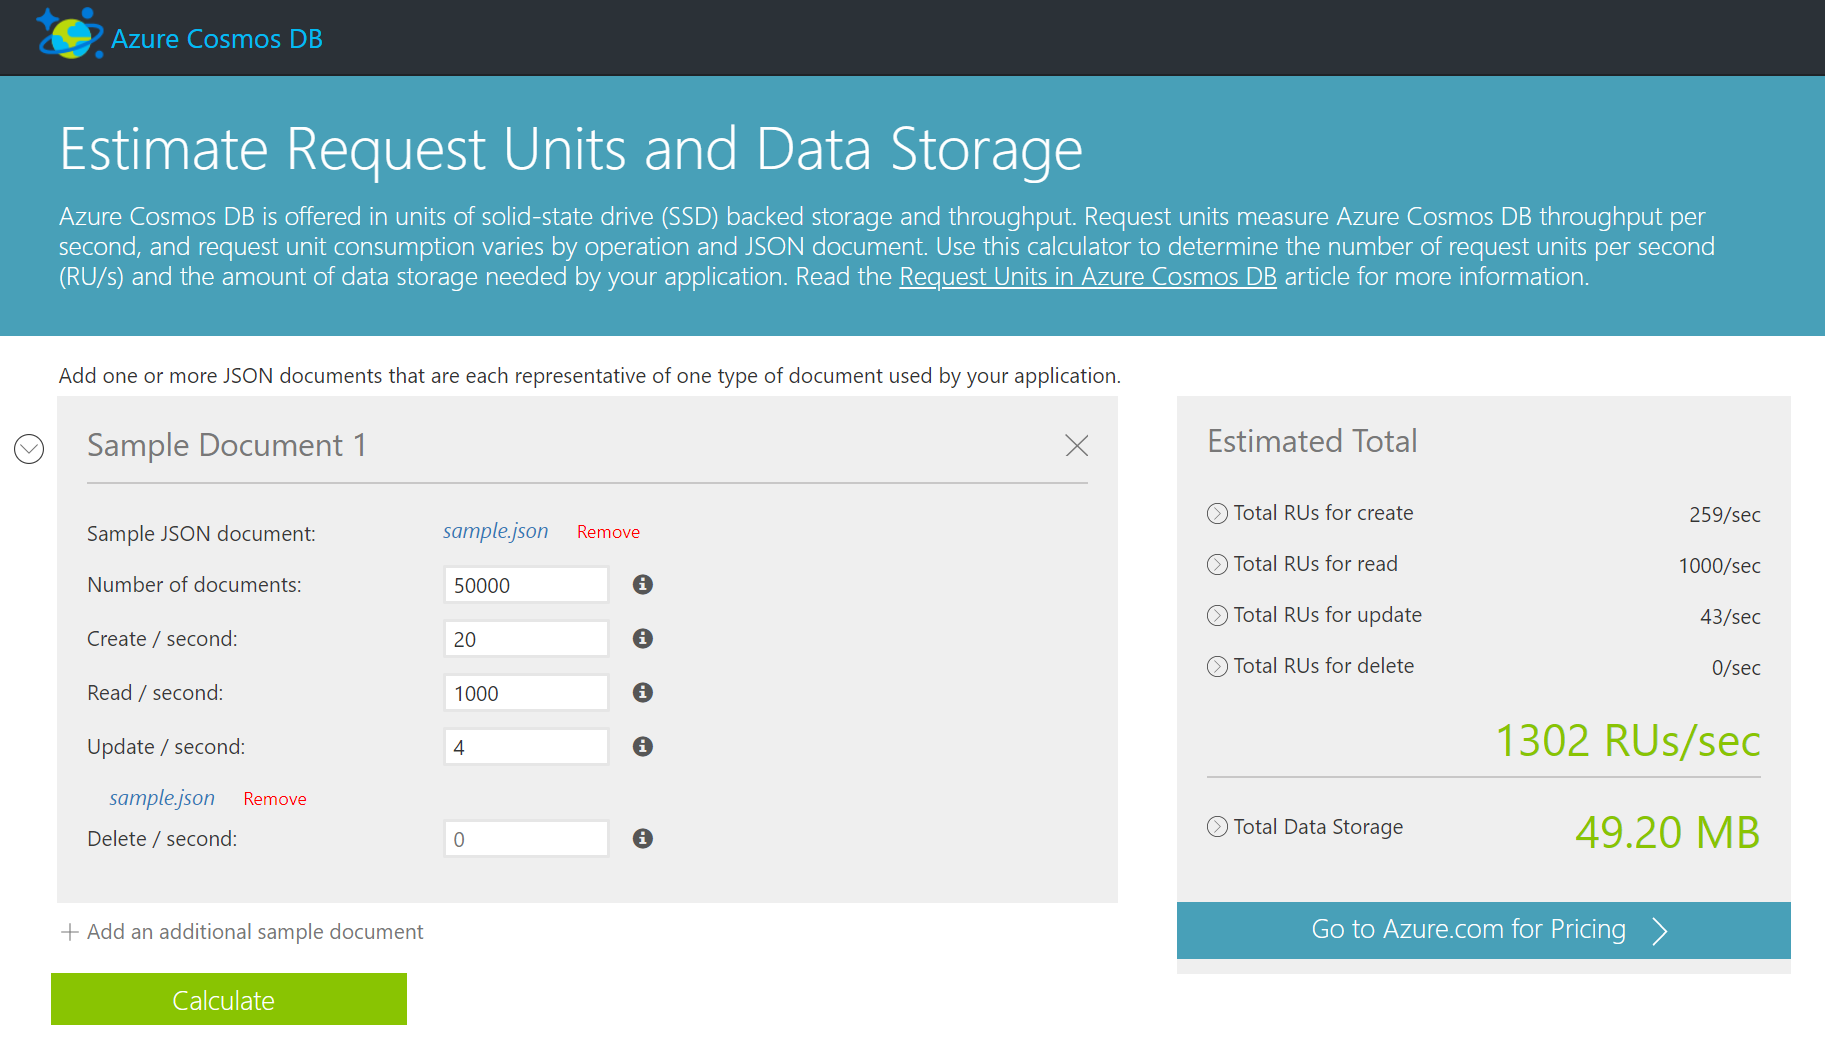
Here we can see that a query-heavy app storing 50,000 documents (of which sample.json was a representation) and expecting 20 new documents and 4 updates per second needs a database provisioned with just over 1,300 RUs.
# Development Insight
While developing your data access strategies, take a look at Performance and scale testing with Azure Cosmos DB (opens new window). It describes an open-source benchmarking project (opens new window) that you can adapt to your own domain to get a more precise accounting of RUs and thus the expected performance of your application. The code uses the .NET SDK and specifically applies to inserts into a document database (versus tables or graphs), but the concepts in the code can be adapted to your specific data model and query profiles. A key part of the processing is accumulating the RequestCharge from each operation:
ResourceResponse<Document> response = await client.CreateDocumentAsync(
	UriFactory.CreateDocumentCollectionUri(DatabaseName, DataCollectionName),
	newDictionary, new RequestOptions() { });
requestUnitsConsumed[taskId] += response.RequestCharge;
2
3
4
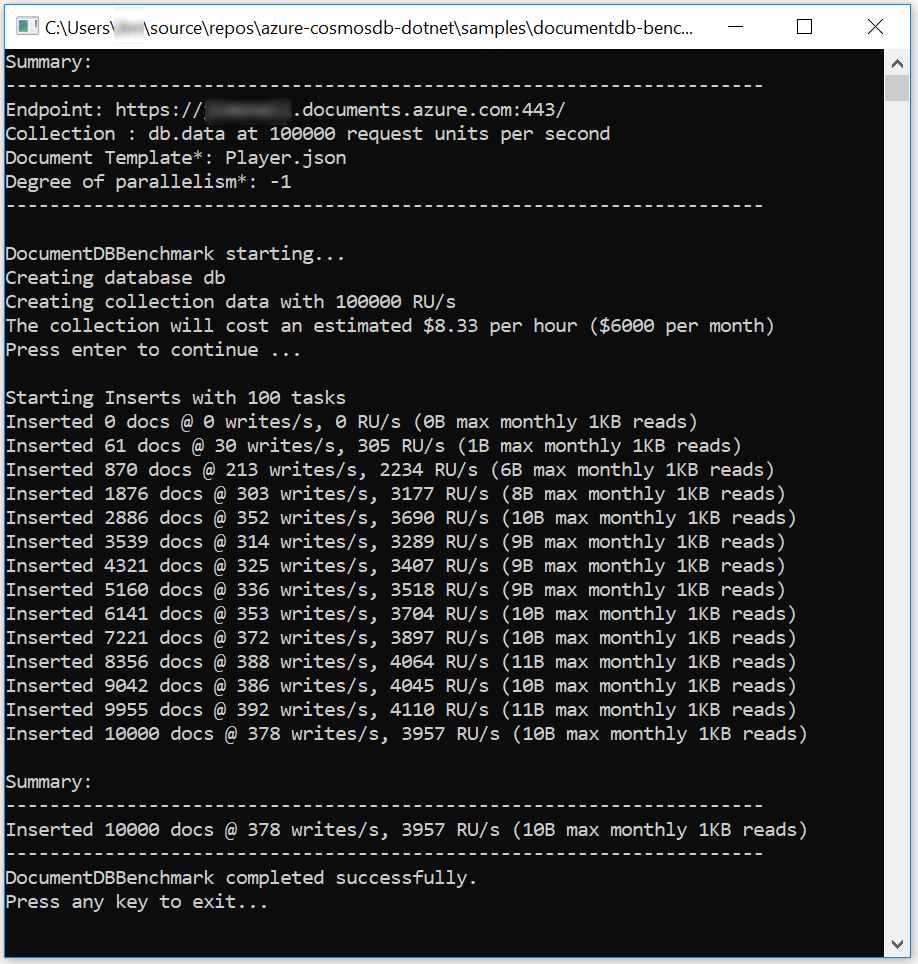
For the execution captured below, the exact cost of inserting 10,000 test documents is slightly less 4,000 RU/s or 4 percent of the provisioned throughput for this collection (as noted in the collection summary line at the top of the console output).
It's important to note, too, that partitioning (opens new window), consistency levels (opens new window), and indexing (opens new window) will also have an impact on performance, so you may want to establish a baseline benchmark application and judiciously modify various configuration options and settings to determine their effect on performance.
Also consider using the Azure Cosmos DB Emulator (opens new window) as the target of the performance testing application. It only supports document style databases and doesn't simulate different consistency levels, but it will provide insight into RU costs without incurring actual charges for running your performance tests against your Azure instance.
# Production Monitoring
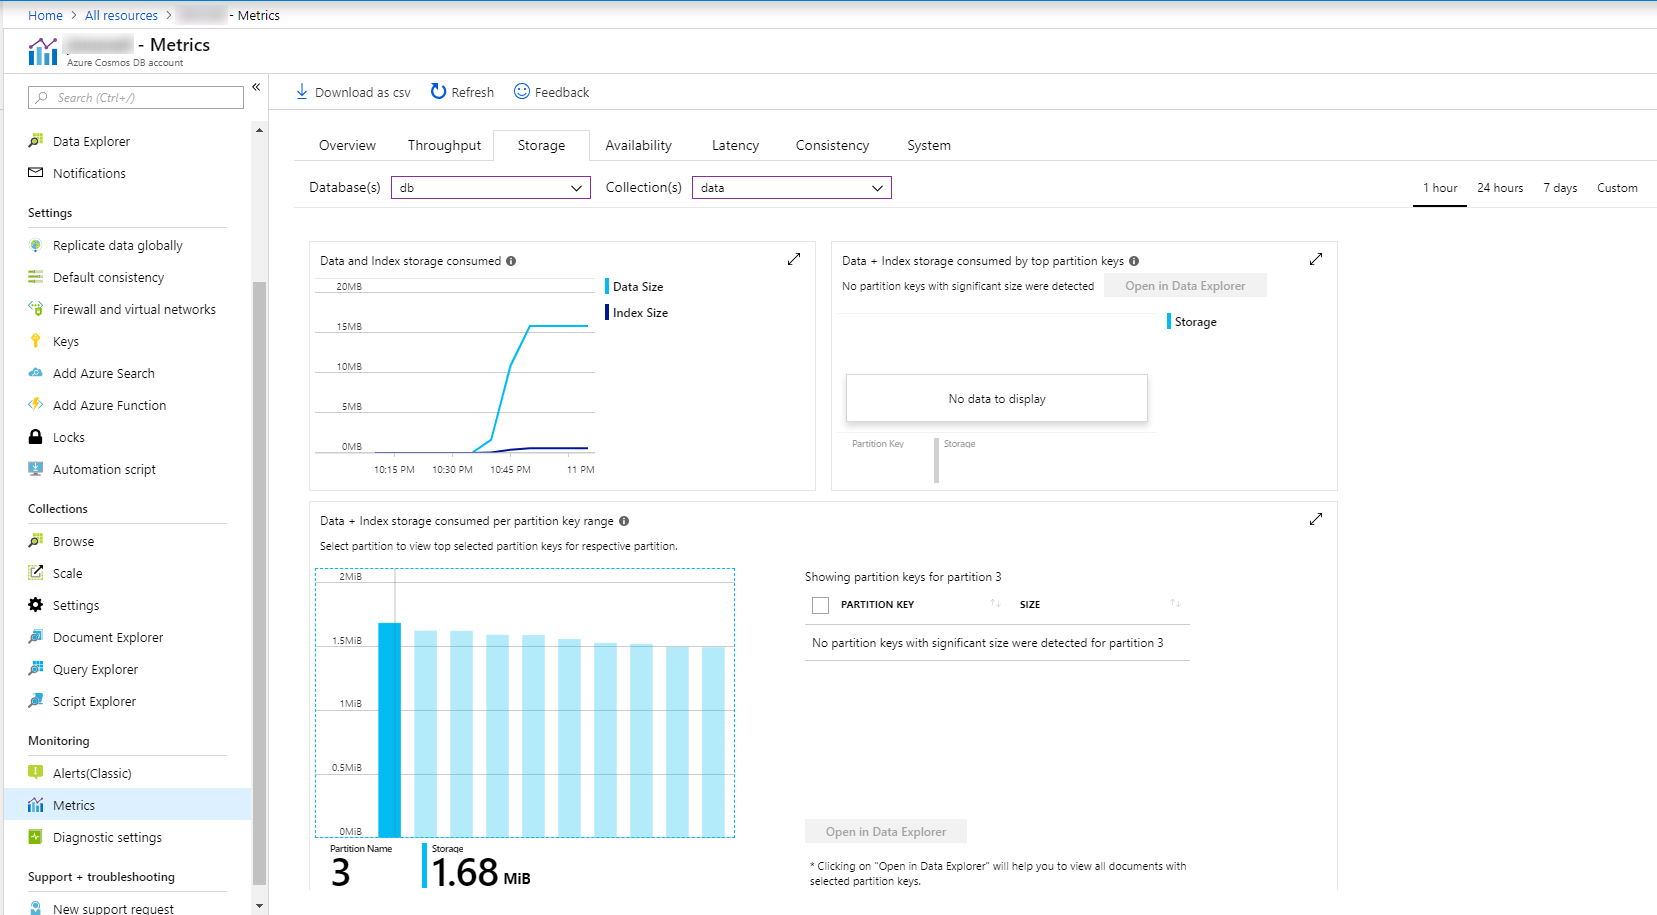
For an operational database, the Azure portal Monitoring -> Metrics blade provides in-depth statistics on throughput, storage, availability, and latency. The Storage tab is of particular interest in that it lends insight into the partitioning of the data. Be sure to drill down into a specific database and collection to see the partition-specific metrics.
In the snapshot captured here, partitions are relatively evenly distributed, which indicates a good choice for a partition key. Had one partition been exceedingly large (or 'hot'), it could well be a performance bottleneck, and the accompanying list of the predominant keys in that partition could provide some suggestions for tweaking the partitioning strategy.
As you use the insight from these metrics to resolve potential bottlenecks, take a look at the performance tips offered by Microsoft in the following links: