Task 01: Review Microsoft Defender solutions
Gain visibility and strengthen your organization’s security posture from a single, unified portal. Use Microsoft Defender to safeguard assets, prioritize risks, track exposure, and explore attack paths with actionable insights.
-
Review Exposure management to learn about reducing threat exposure and improving posture.
Use Exposure management to centrally assess exposure risk, discover and monitor assets, investigate risk areas with initiatives, and track posture metrics.
Expand here to review Exposure management
- In the leftmost pane, select Exposure management > Secure score.
-
Review your organizations Secure Score and high-risk exposures.
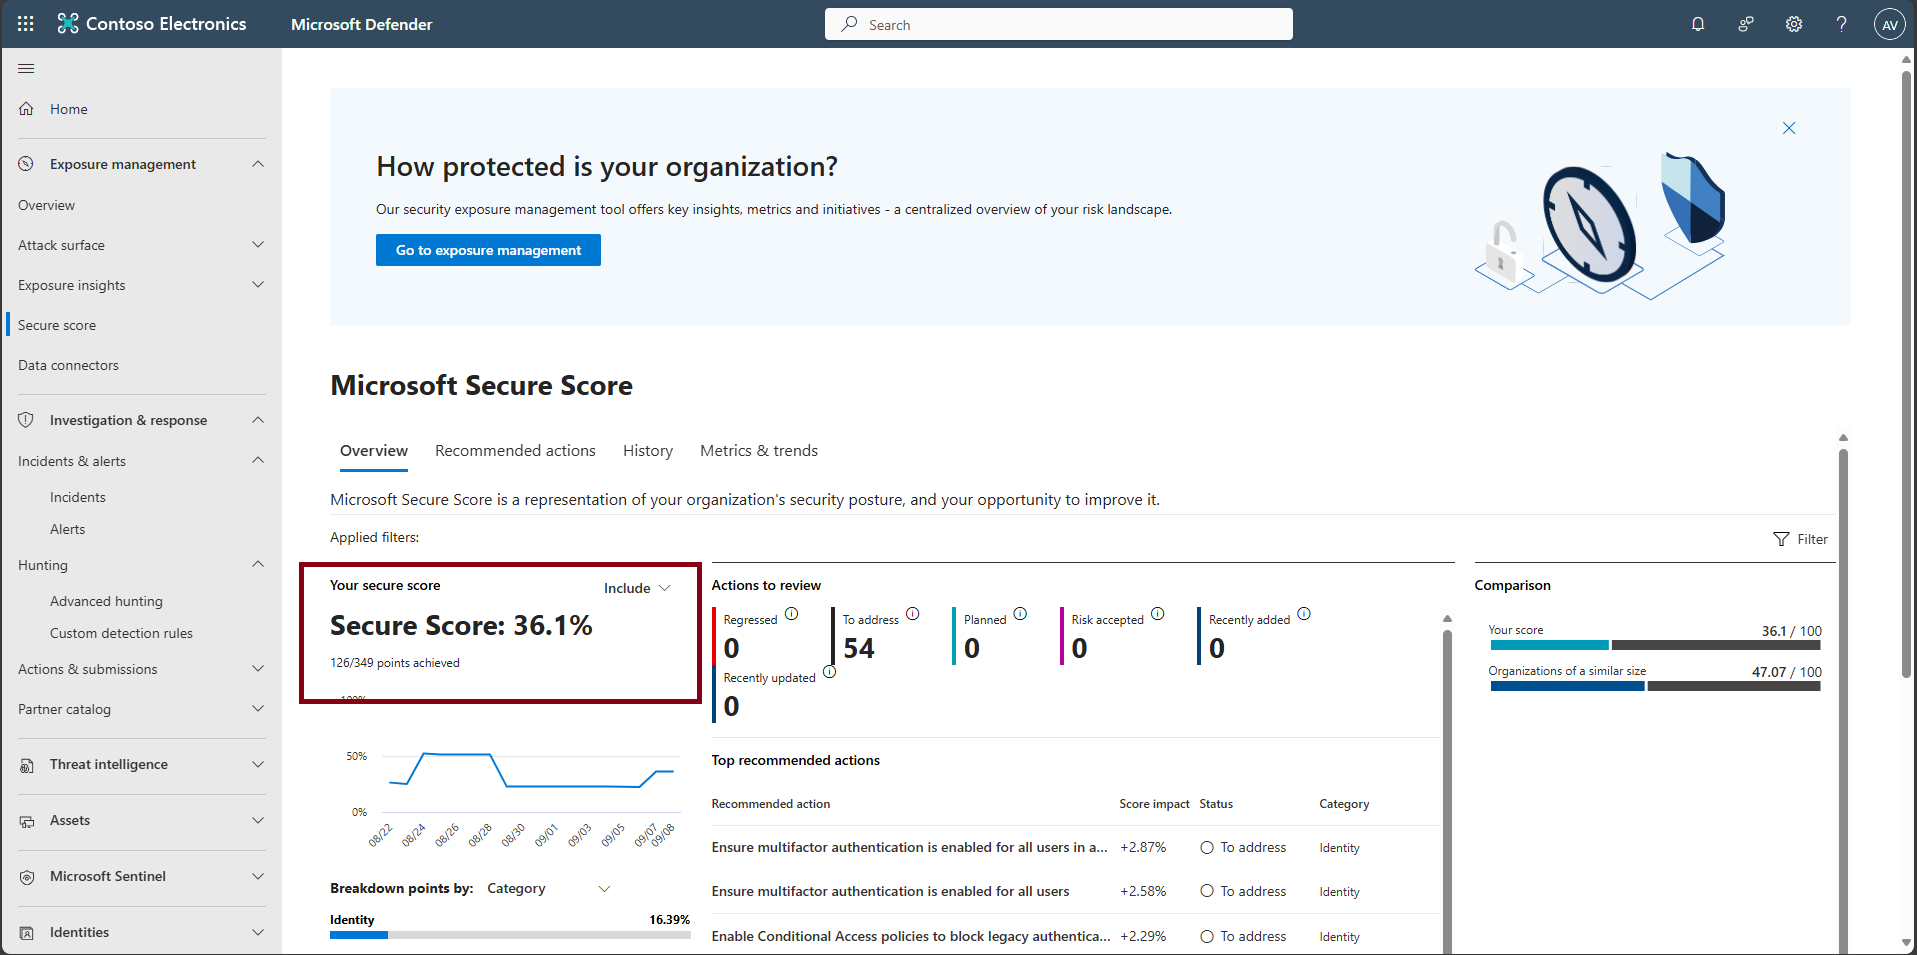
-
Observe recommendations and asset classes driving the exposure.
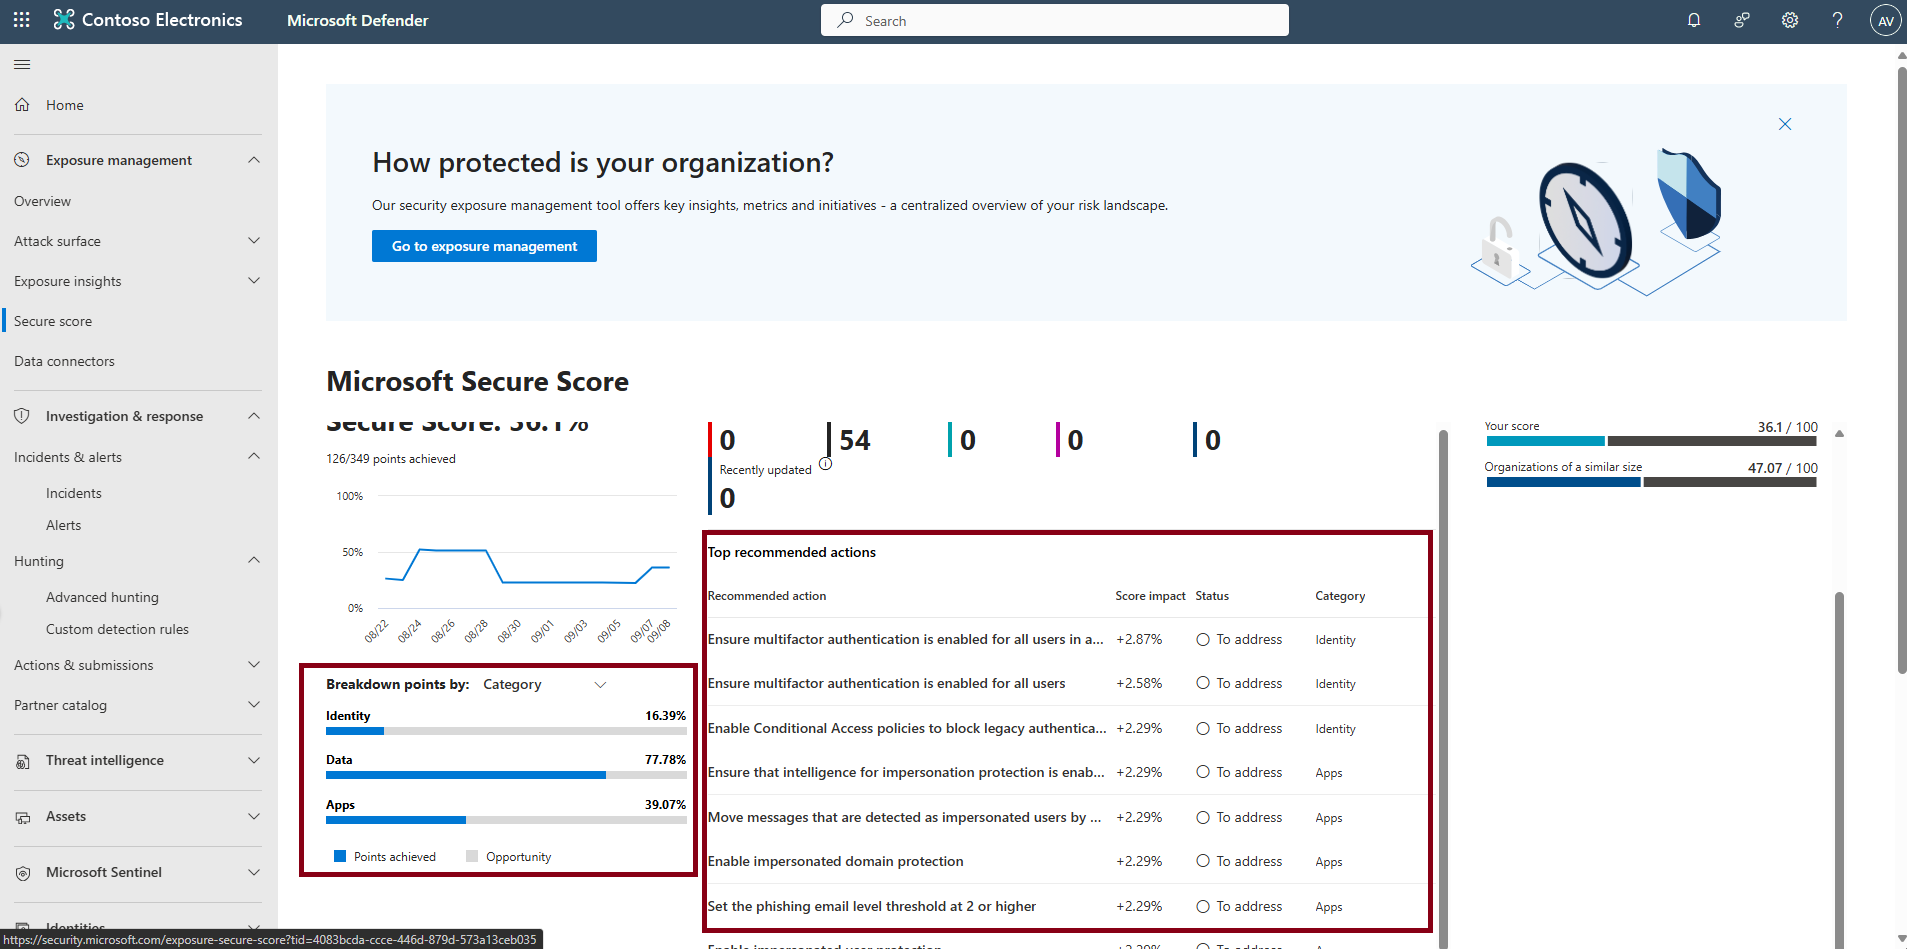
-
Review Investigation & response to check incidents and alerts.
There are no incidents or alerts currently showing as it is a clean XDR environment and this is normal.
Expand here to review Incidents & alerts
-
In the leftmost pane, select Investigation & response > Incidents & alerts > Incidents.
-
Set the time filter to 1 Day; review incidents.
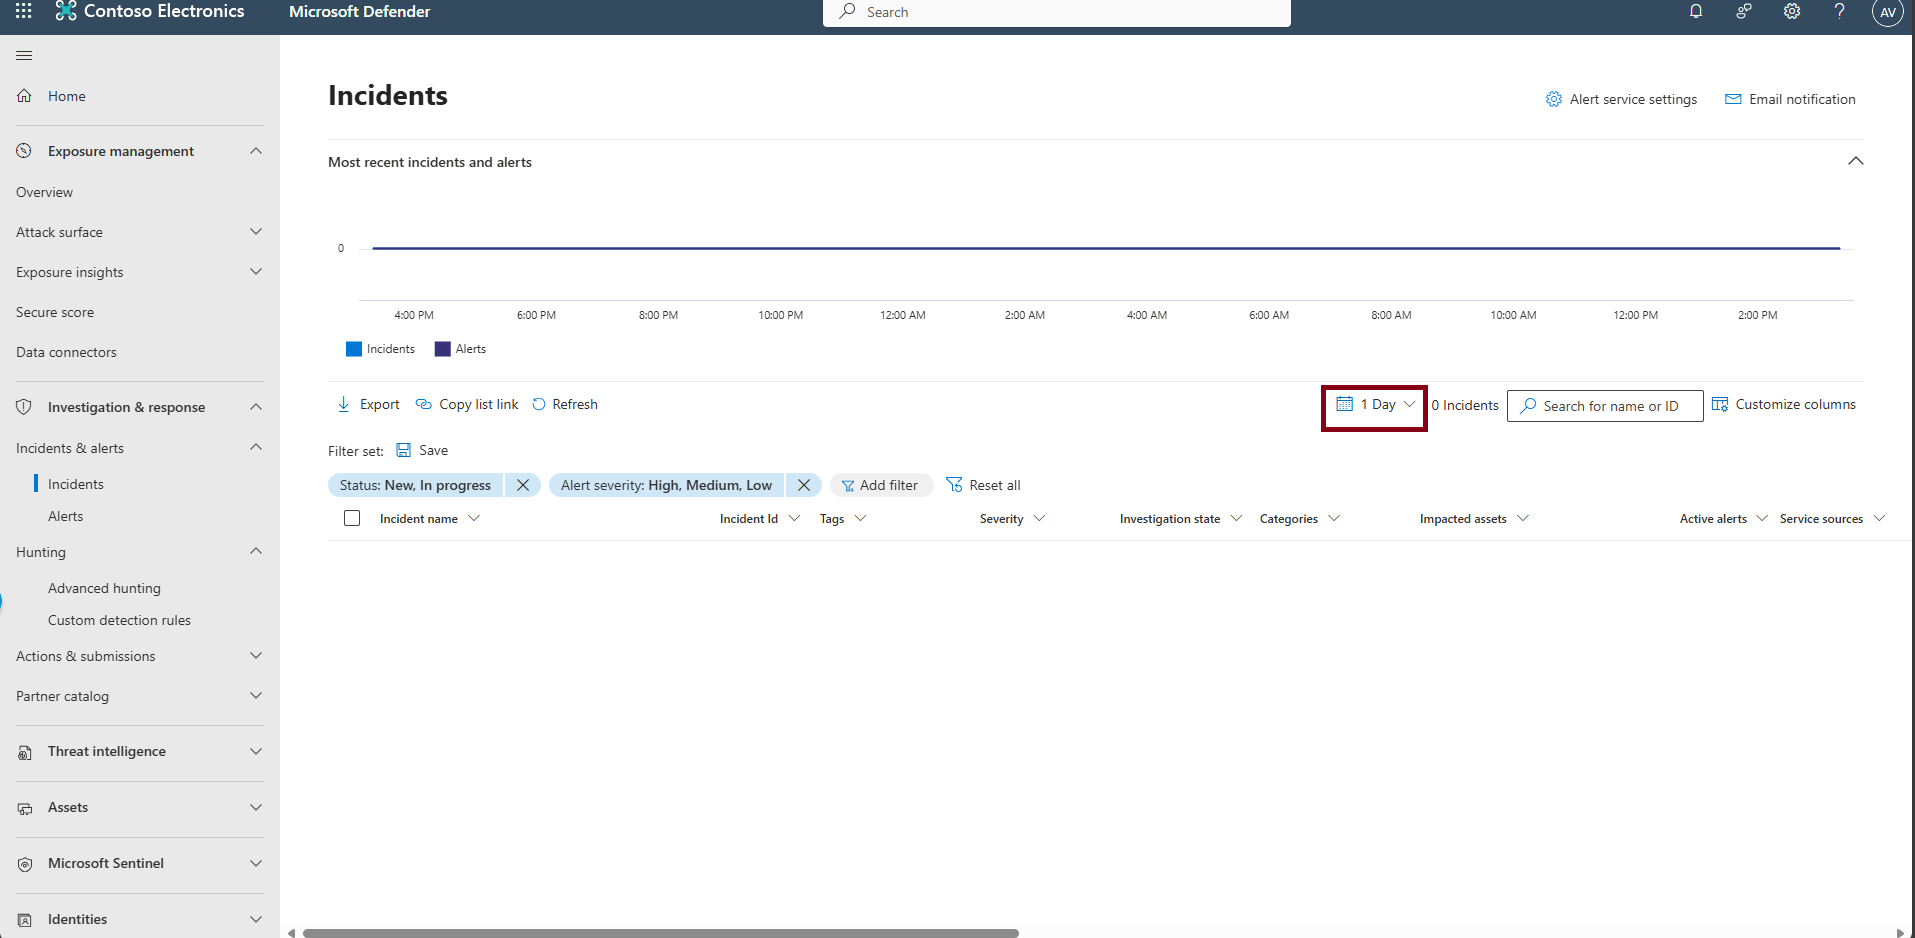
-
In the leftmost pane, under the same subcategory, select Alerts, then review alerts for 1 Day.
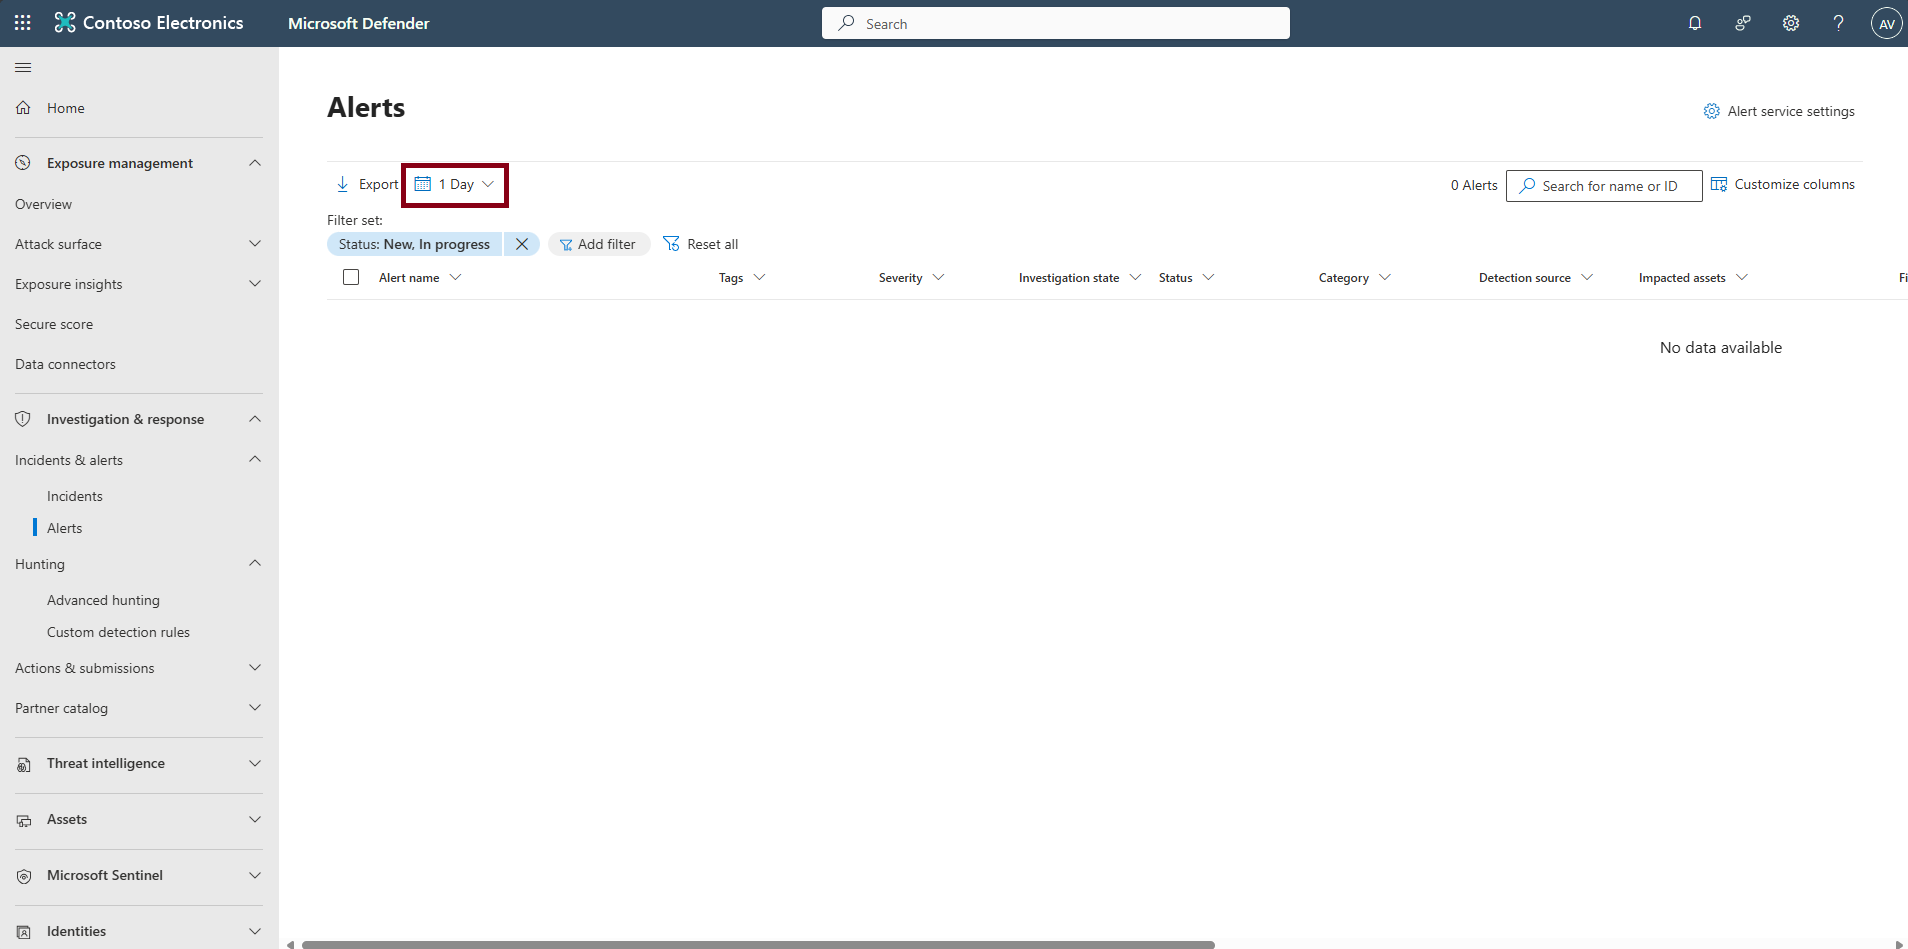
-
-
Review Threat intelligence for recent intel and artifacts.
Expand here to review Threat intelligence
-
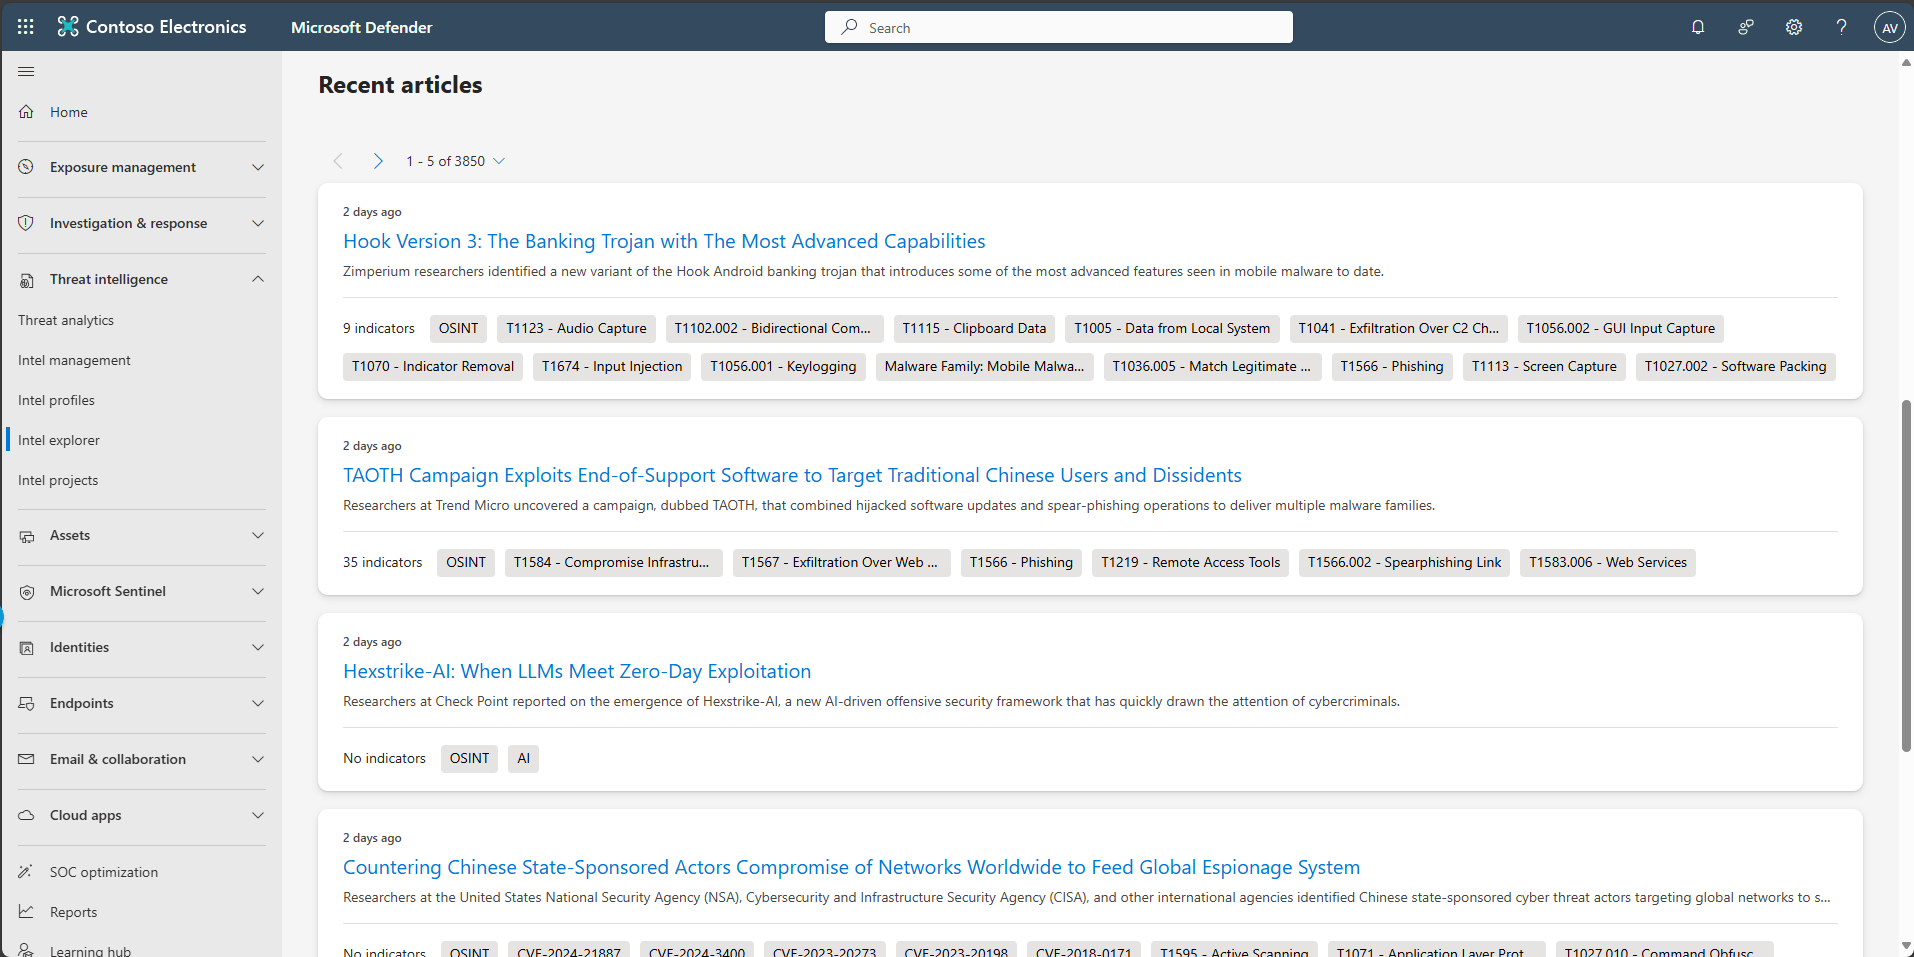
In the leftmost pane, select Threat intelligence, then Intel explorer.
-
Skim recent articles relevant to your environment.
-
-
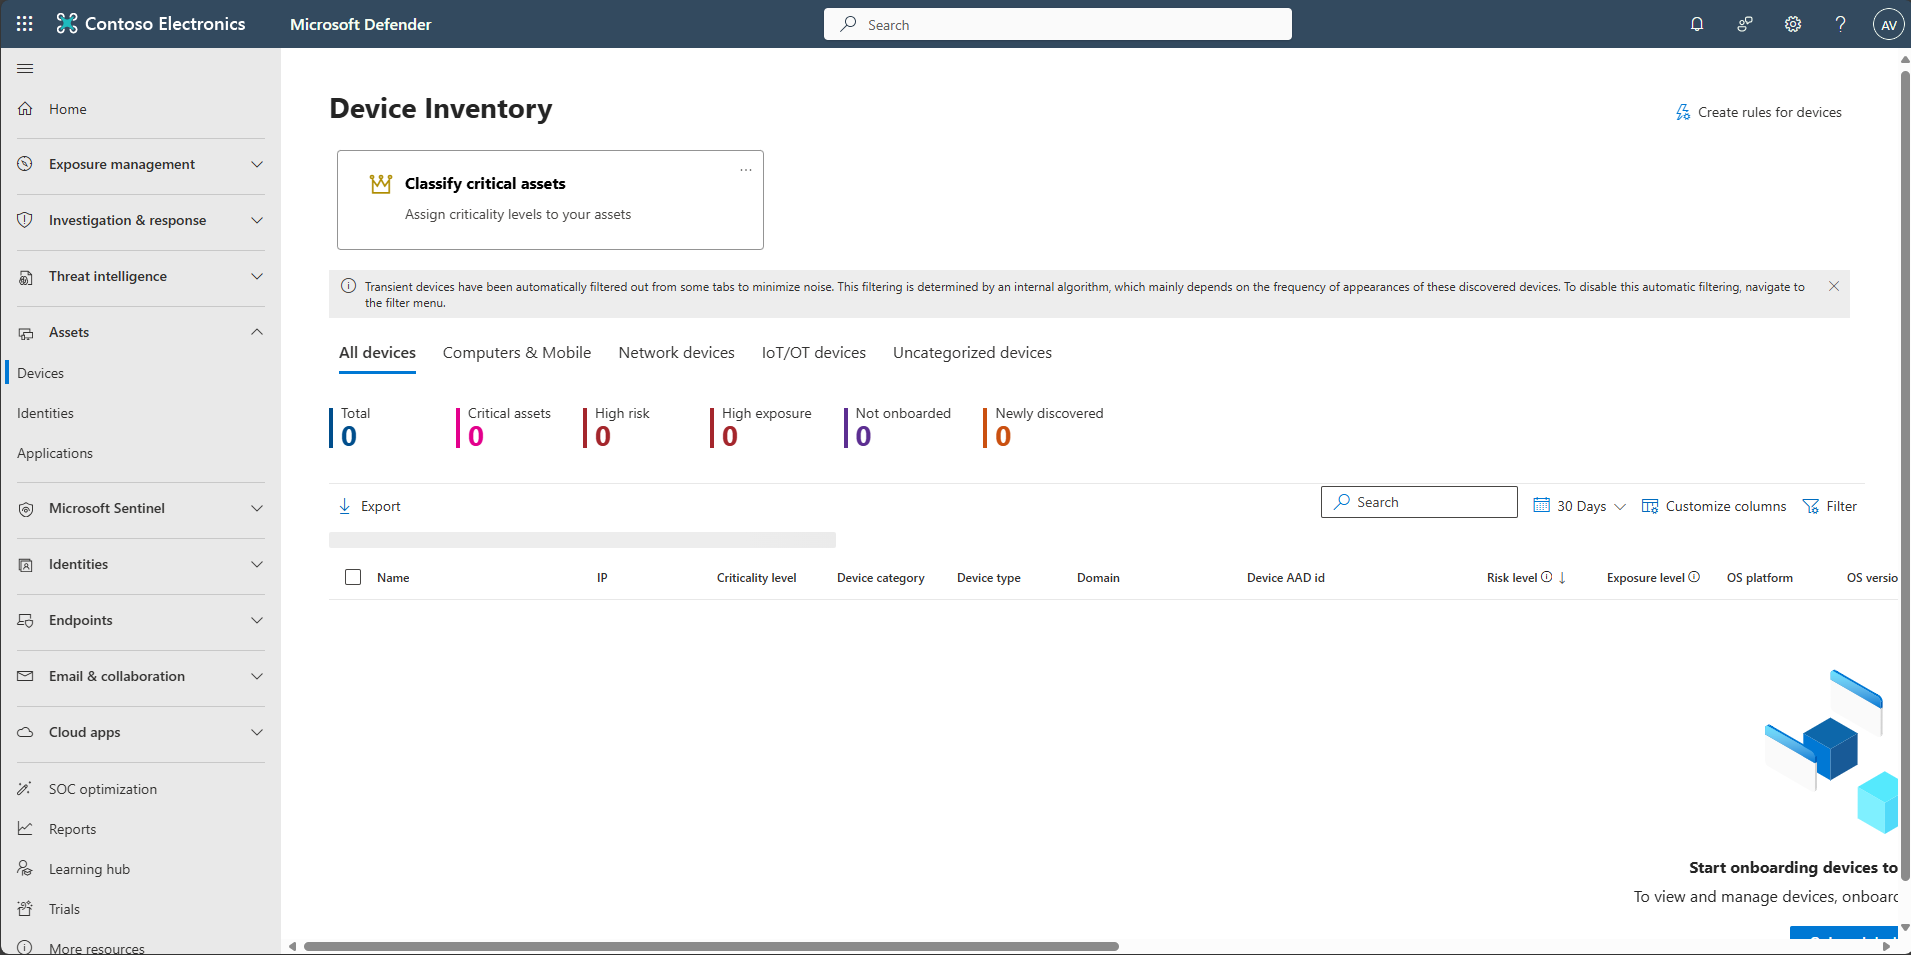
In the leftmost pane, select Assets > Devices to spot-check unhealthy devices.
Once the Windows VM is on boarded successfully, it will be displayed here.
Expand here to review Assets
-
In the leftmost pane, select Assets > Devices to spot-check unhealthy devices.
-
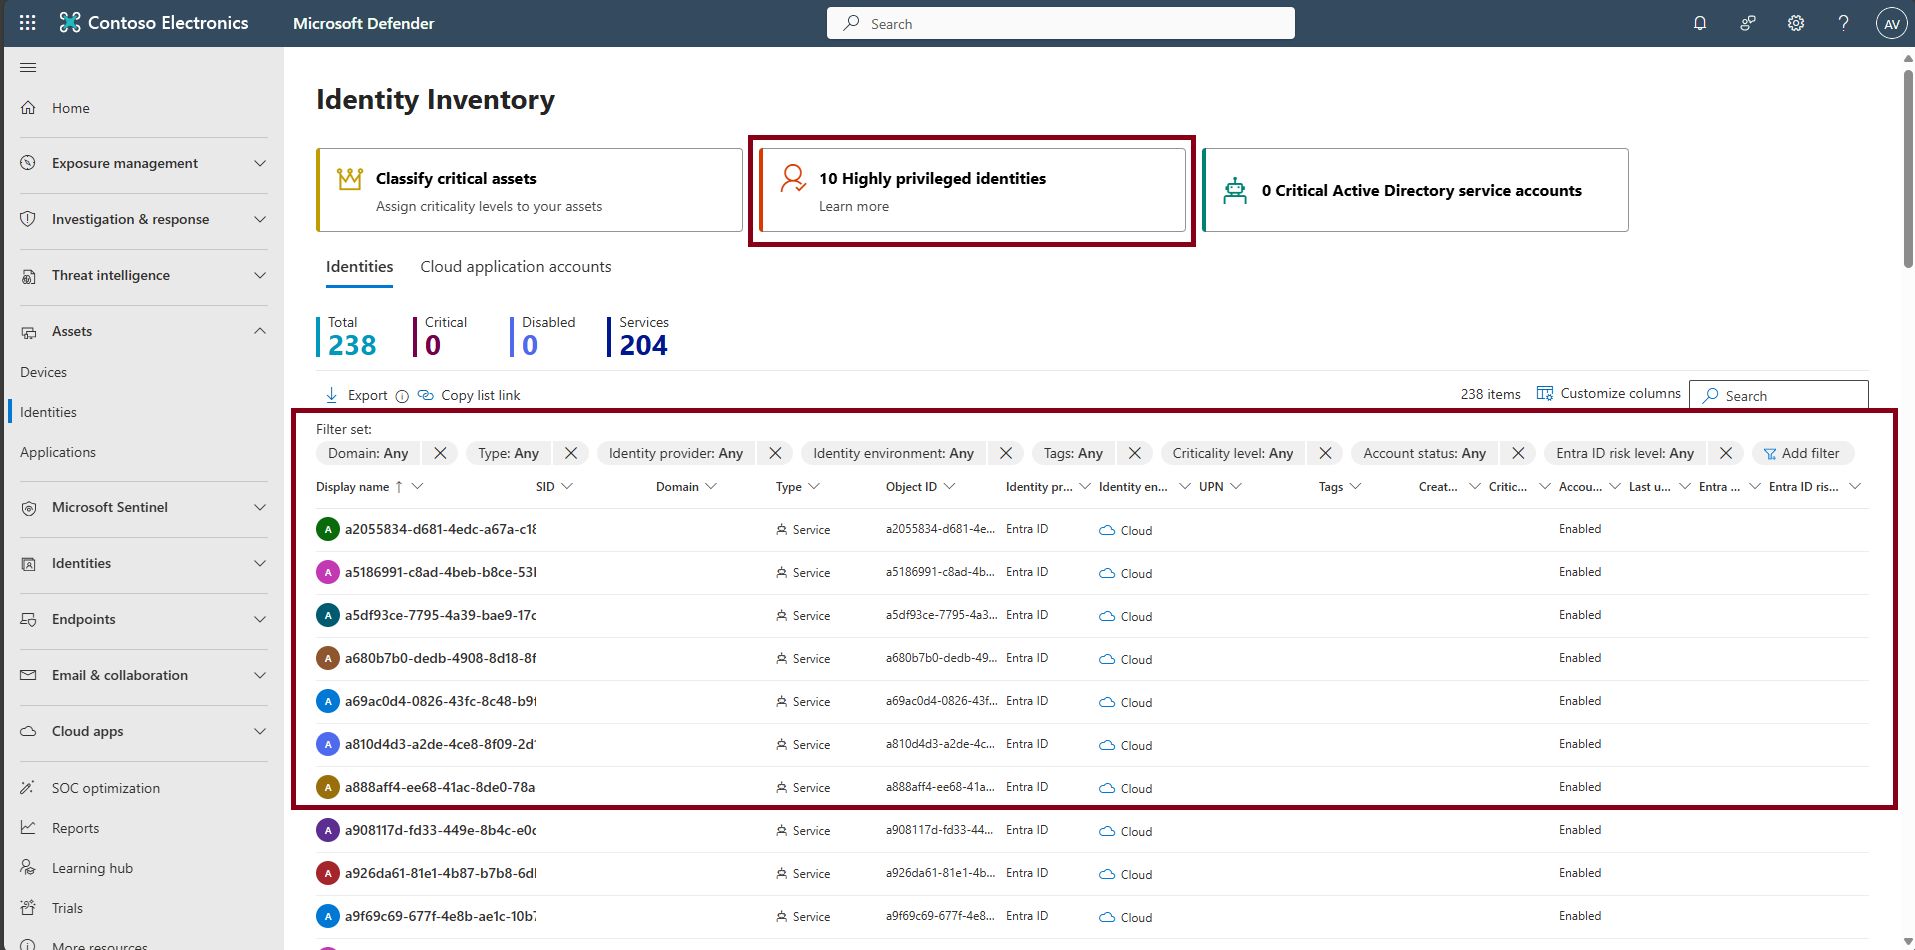
In the leftmost pane, select Assets > Identities to review highly privileged identities.
-
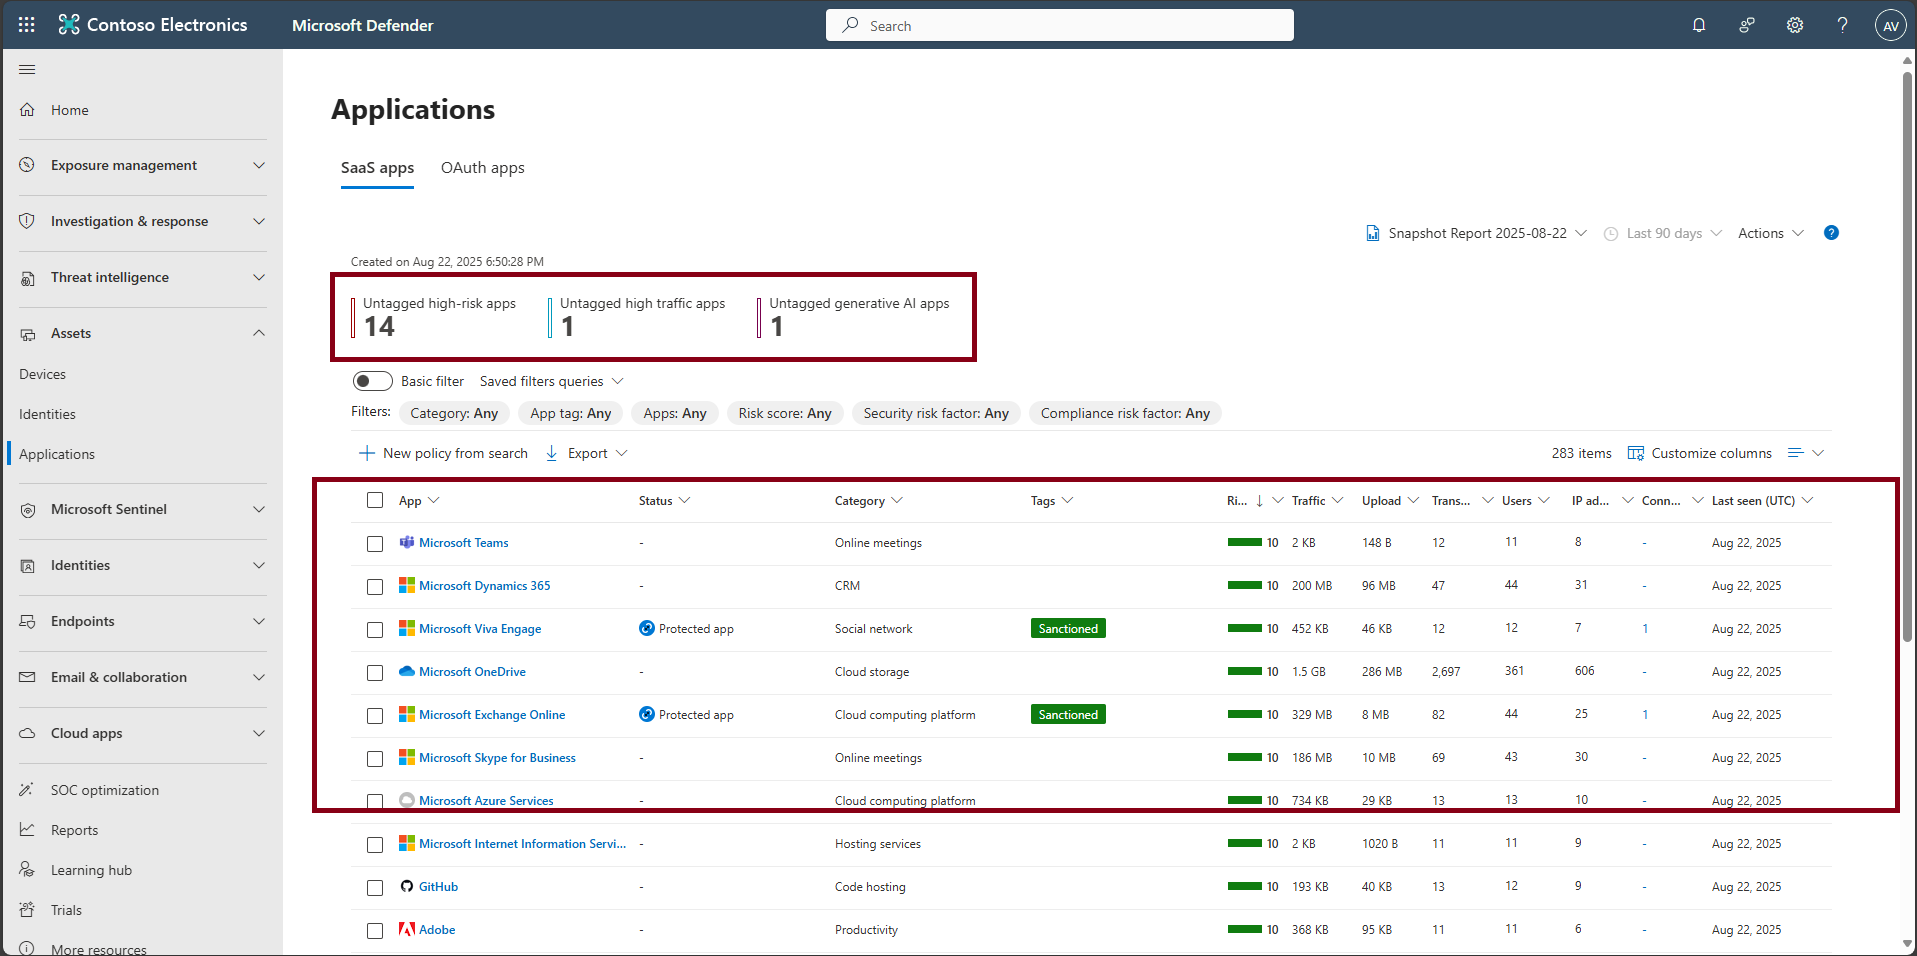
In the leftmost pane, select Assets > Applications to review newly discovered and untagged high-risk, high-traffic, and GenAI apps.
-
-
Review Identities posture and privileged accounts.
Expand here to review Identity posture
-
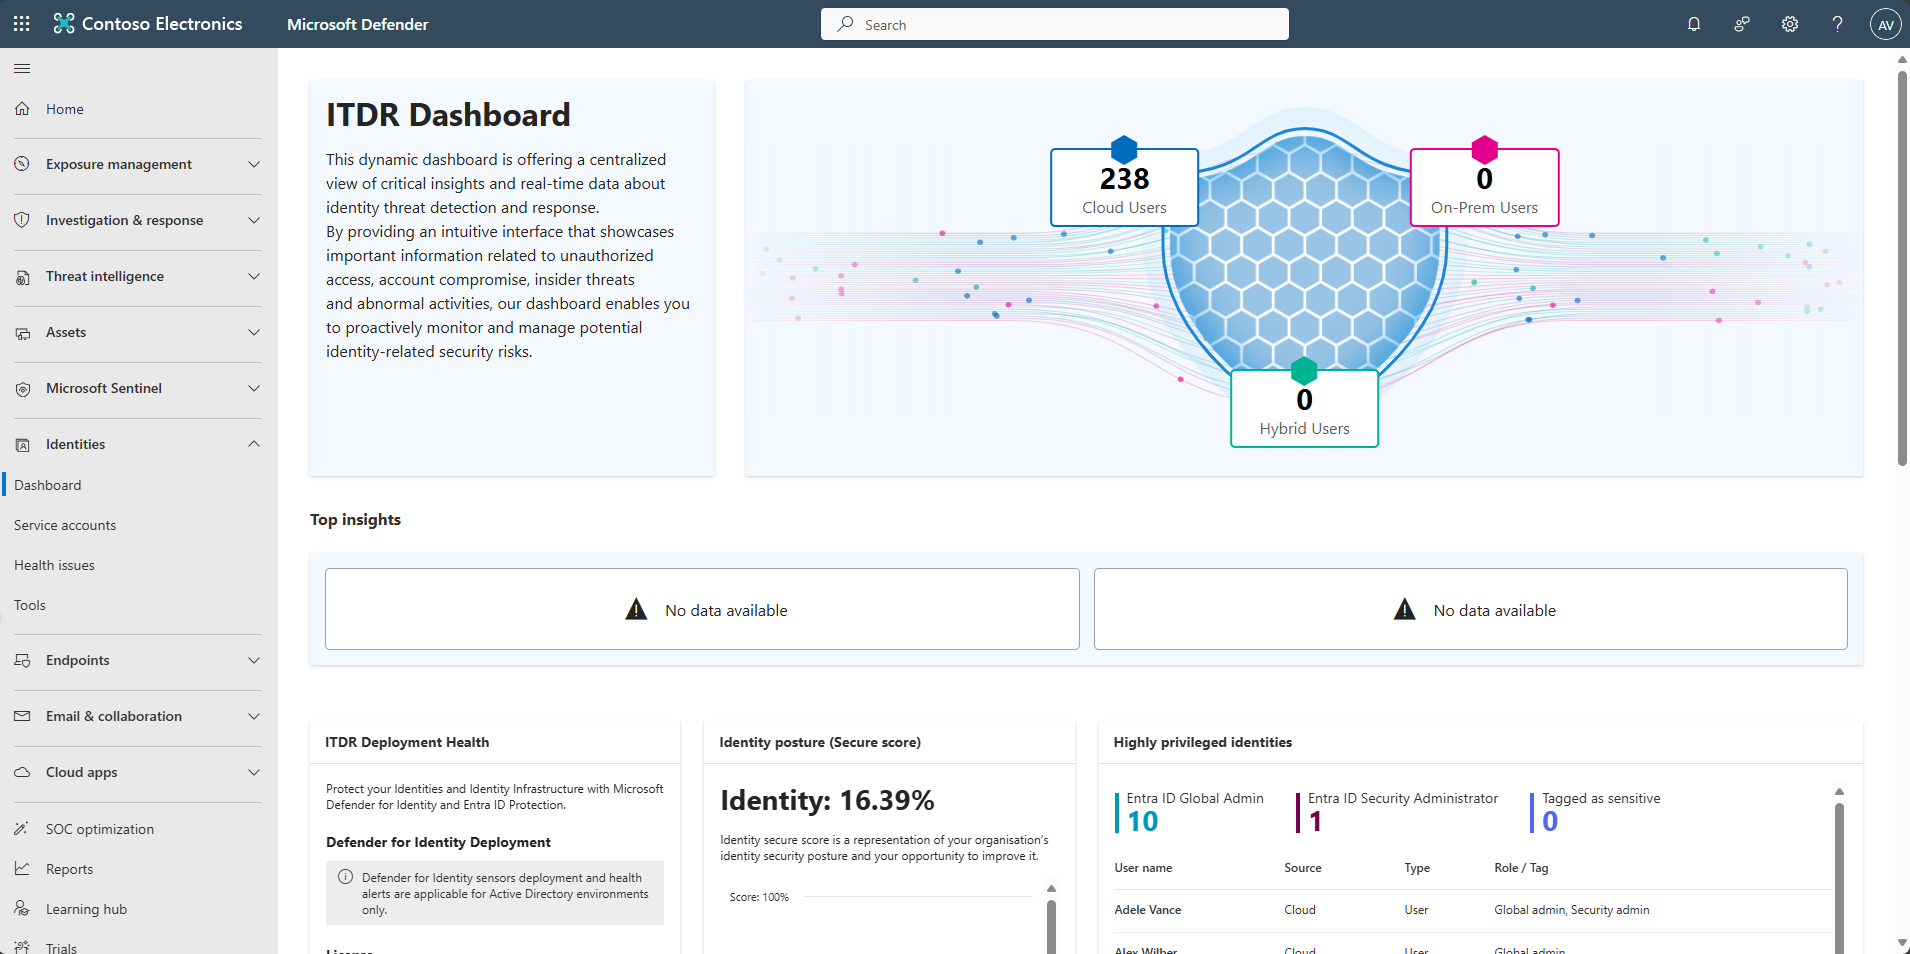
In the leftmost pane, select Identities > Dashboard.
-
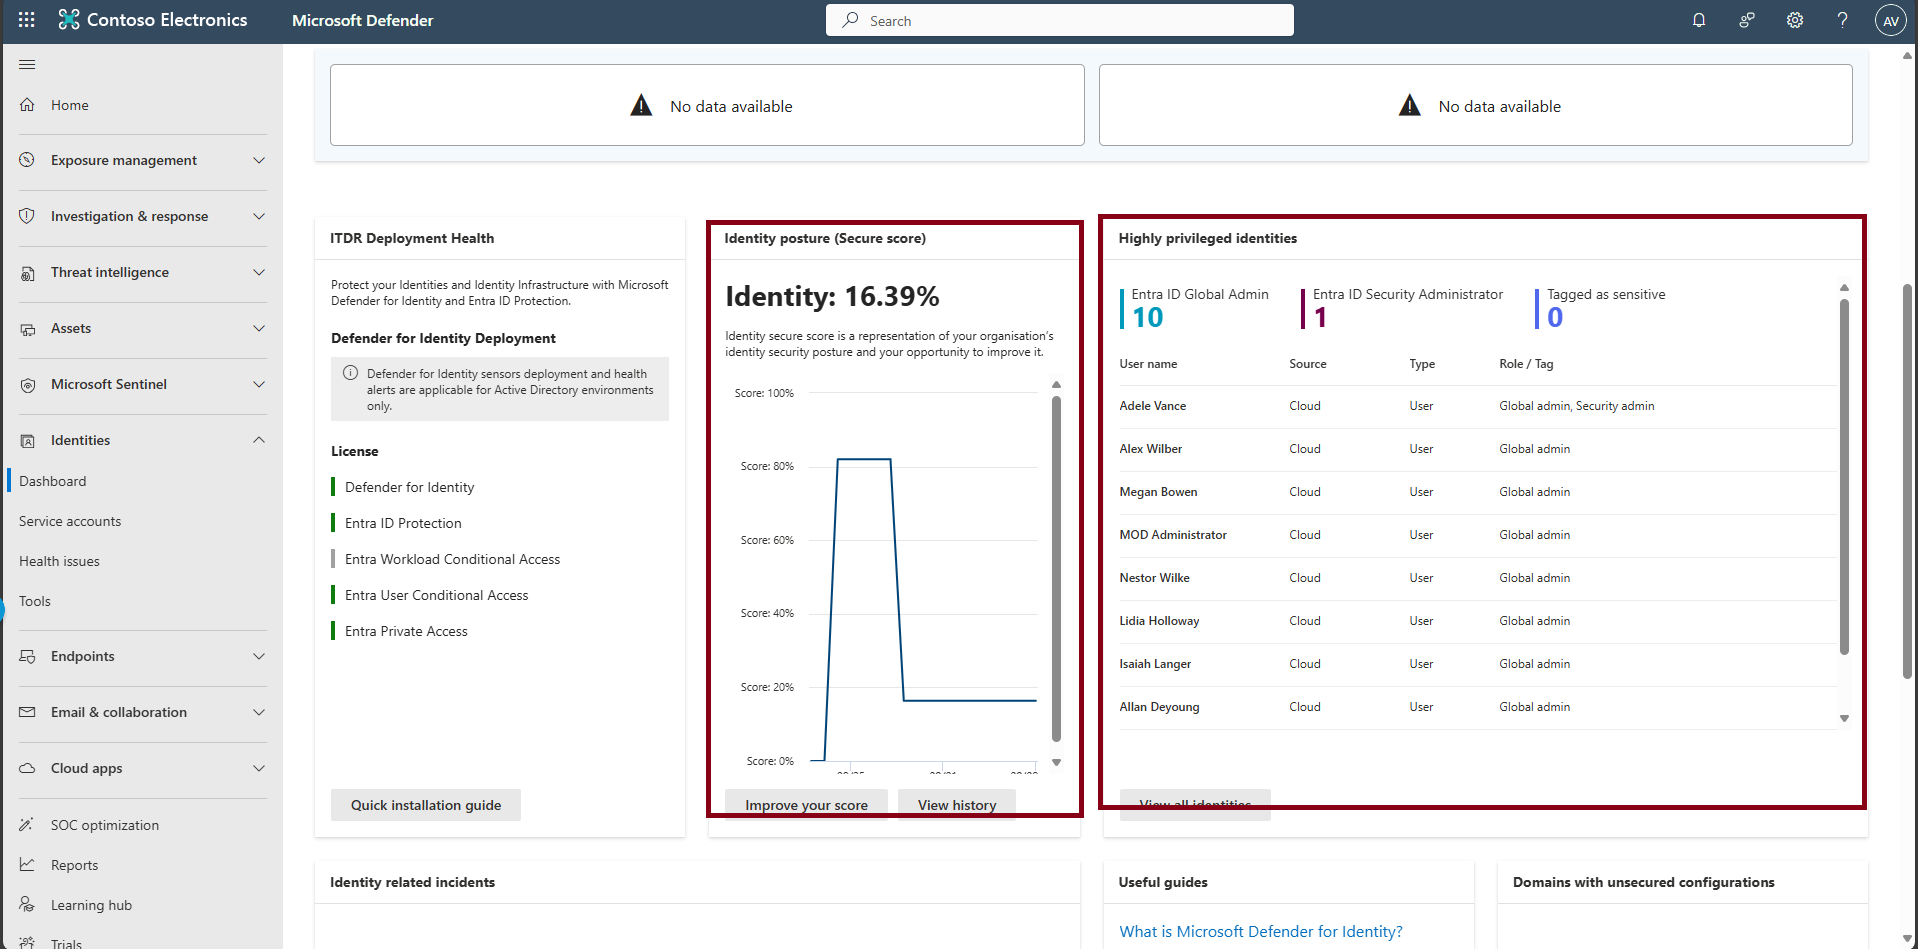
Review Identity posture and highly privileged identities.
-
-
Review Endpoints exposure and recommendations.
Expand here to review Endpoints
-
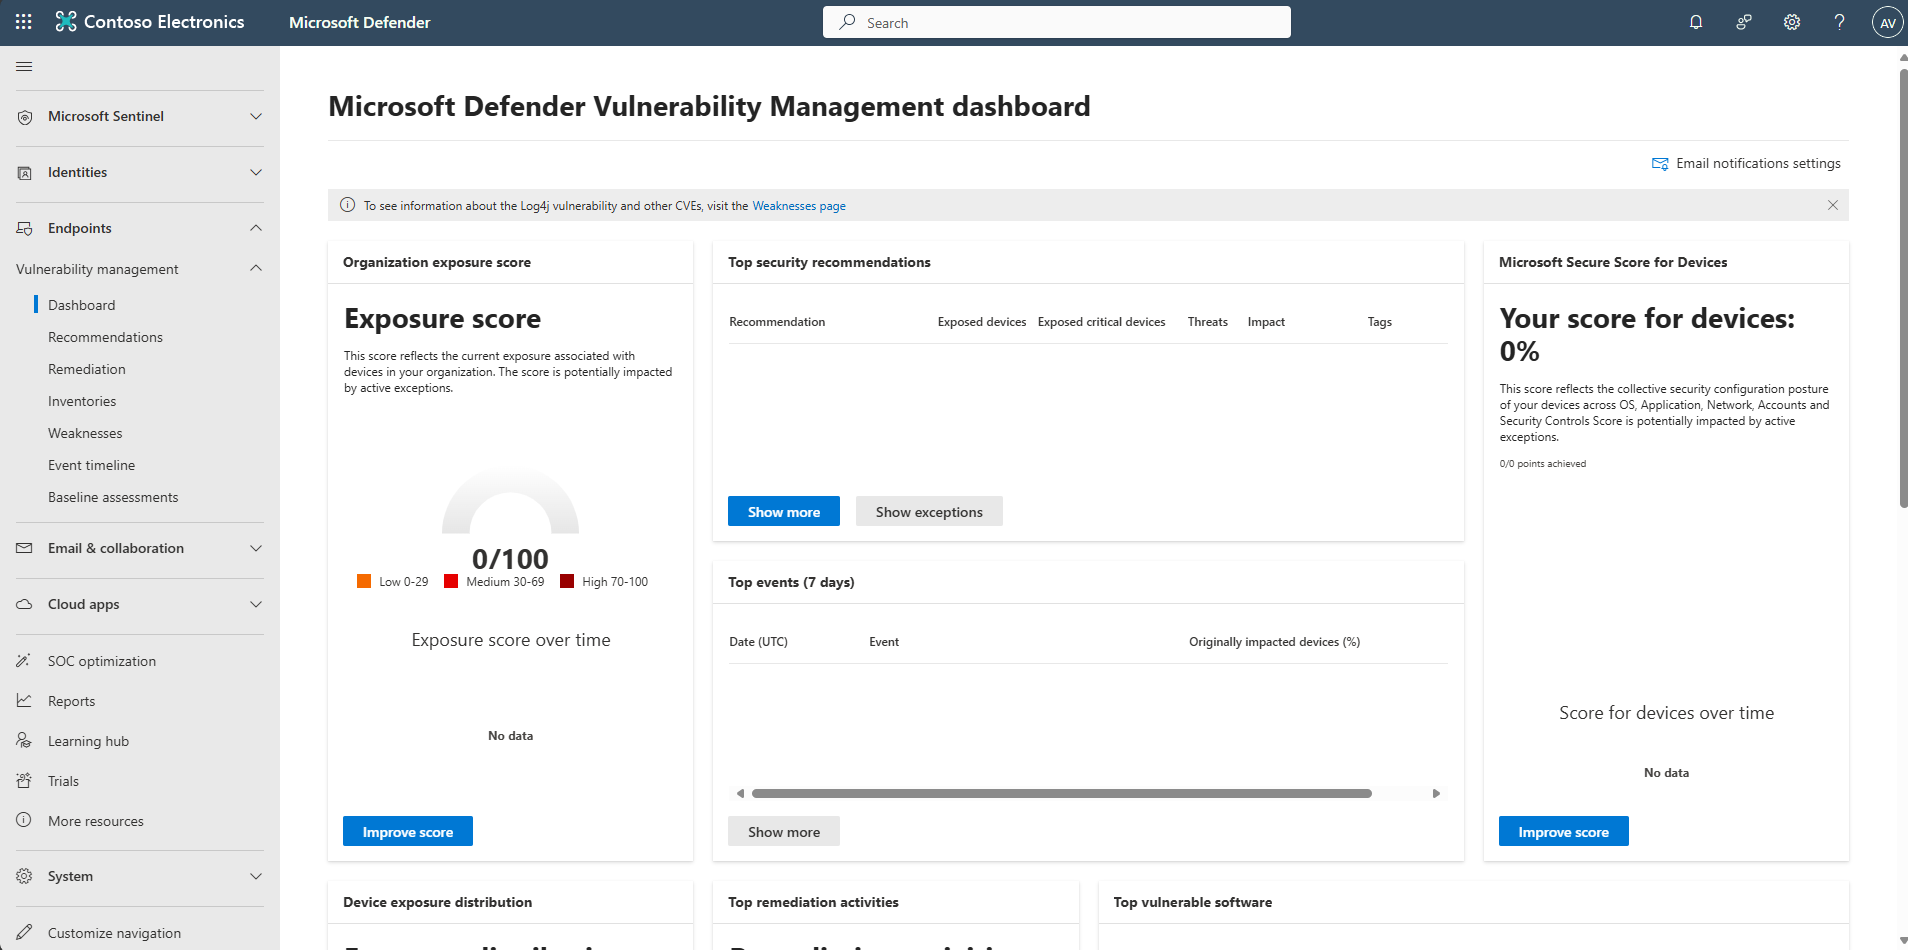
In the leftmost pane, select Exposure management > Vulnerability management > Dashboard.
-
Review exposure score and top recommendations.
-
View your exposure score, which is associated with devices in your company.
-
View your top security recommendations, such as addressing impaired communications with devices, turning on firewall protection, or updating Microsoft Defender Antivirus definitions.
-
View remediation activities, such as any files that were sent to quarantine, or vulnerabilities found on devices.
-
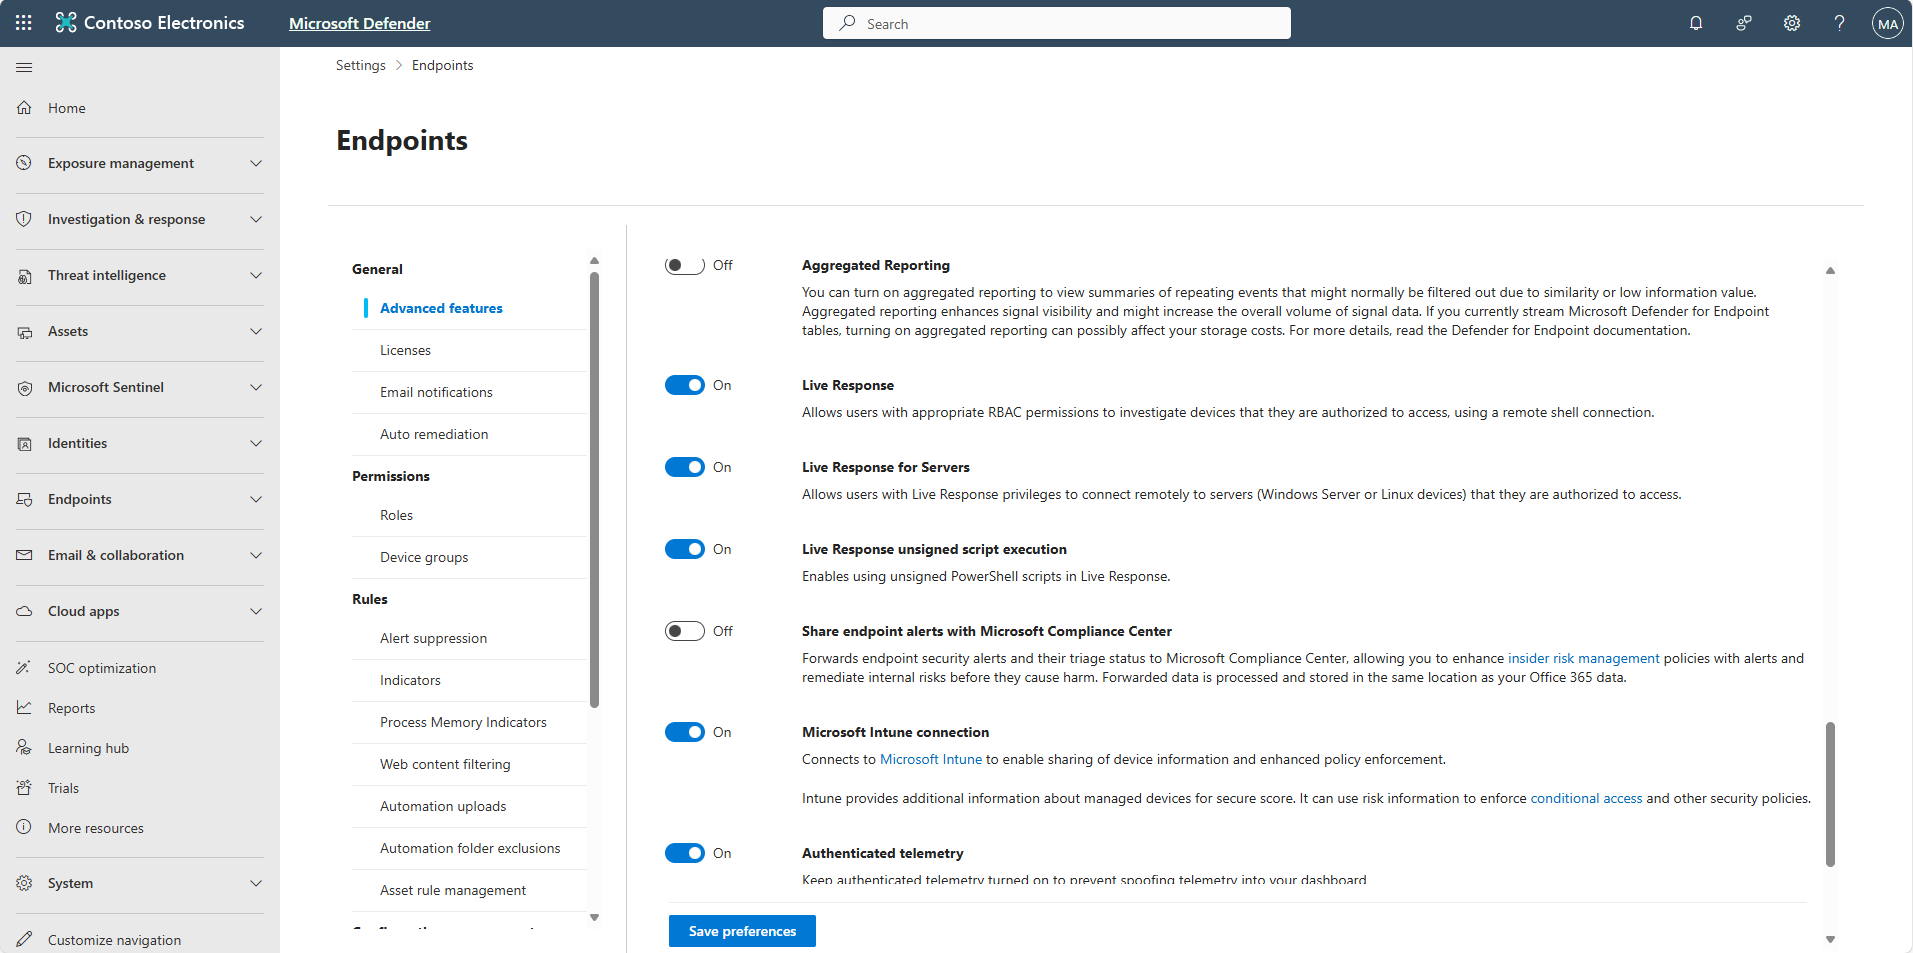
Turn On: Live Response, Live response for servers, and Live response unsigned script execution, then select Save preferences.
-
-
Review Email & collaboration threat activity.
Expand here to review Email & collaboration
-
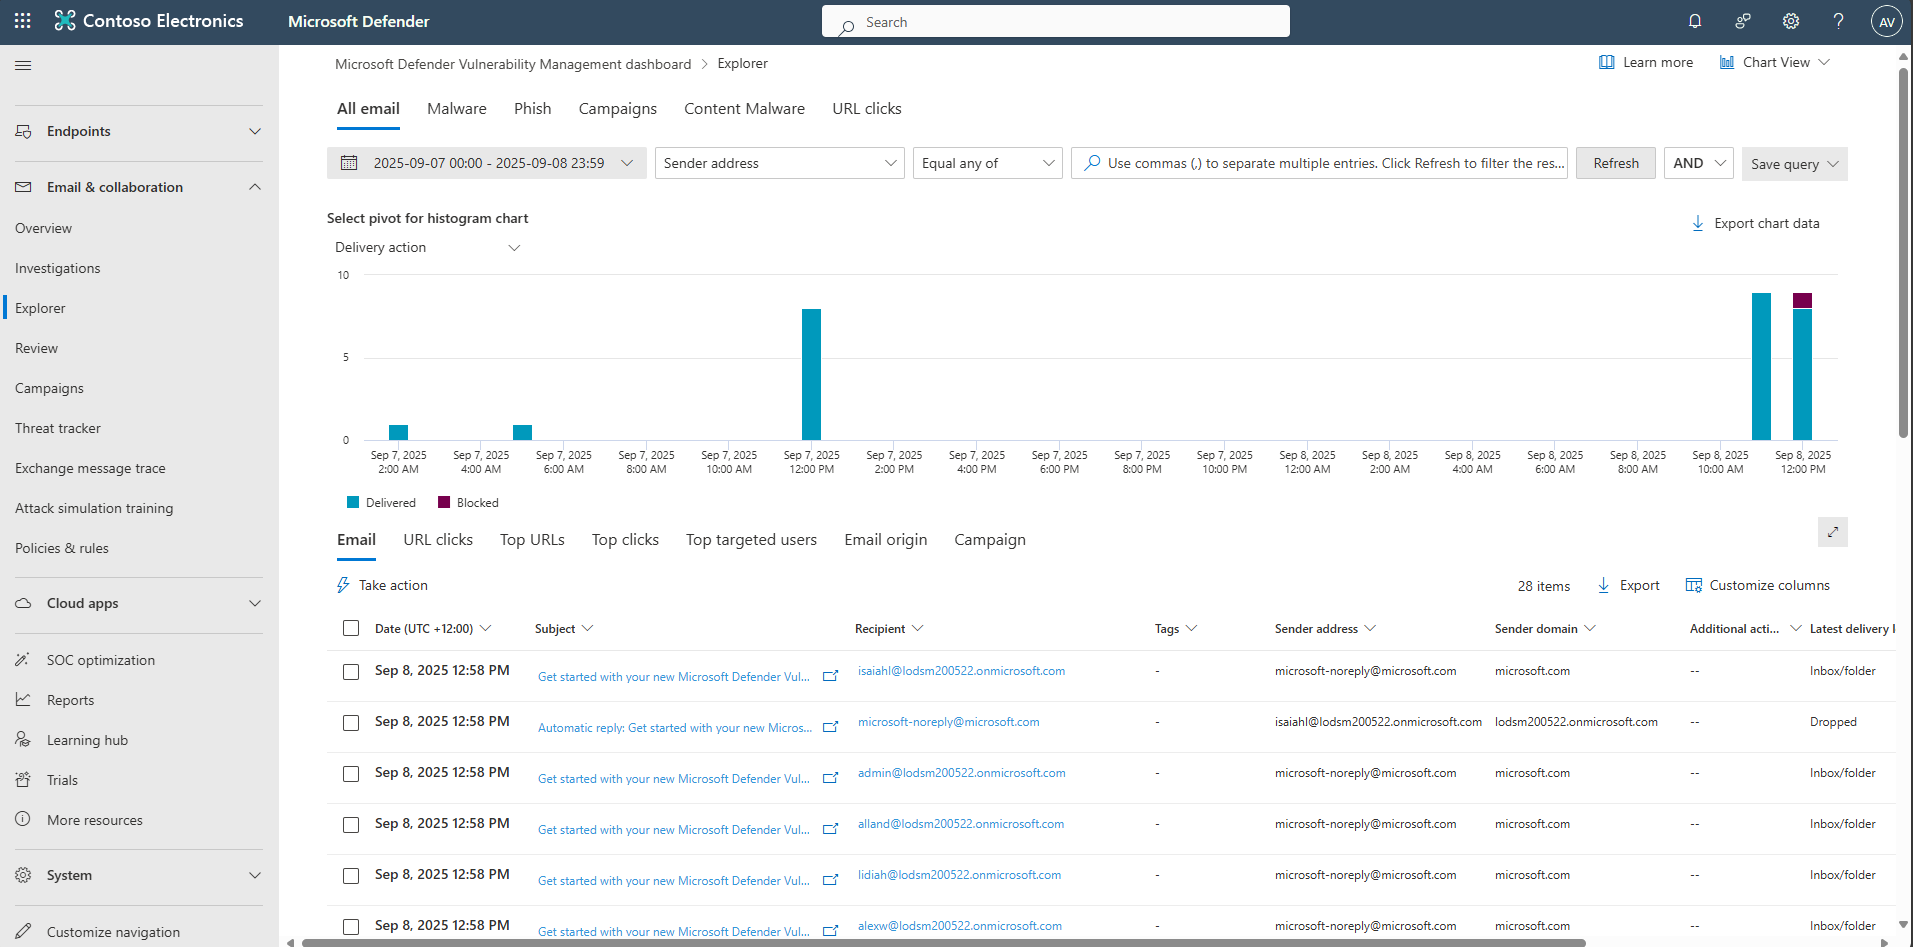
In the leftmost pane, select Email & collaboration, then Explorer.
-
Review recent threats.
Provides information around recent email threats (Phish, malware, spam, URLs, attachments and campaigns), pivot into message details and take response actions.
-
-
Review Cloud apps discovery and governance.
Expand here to review Cloud apps
-
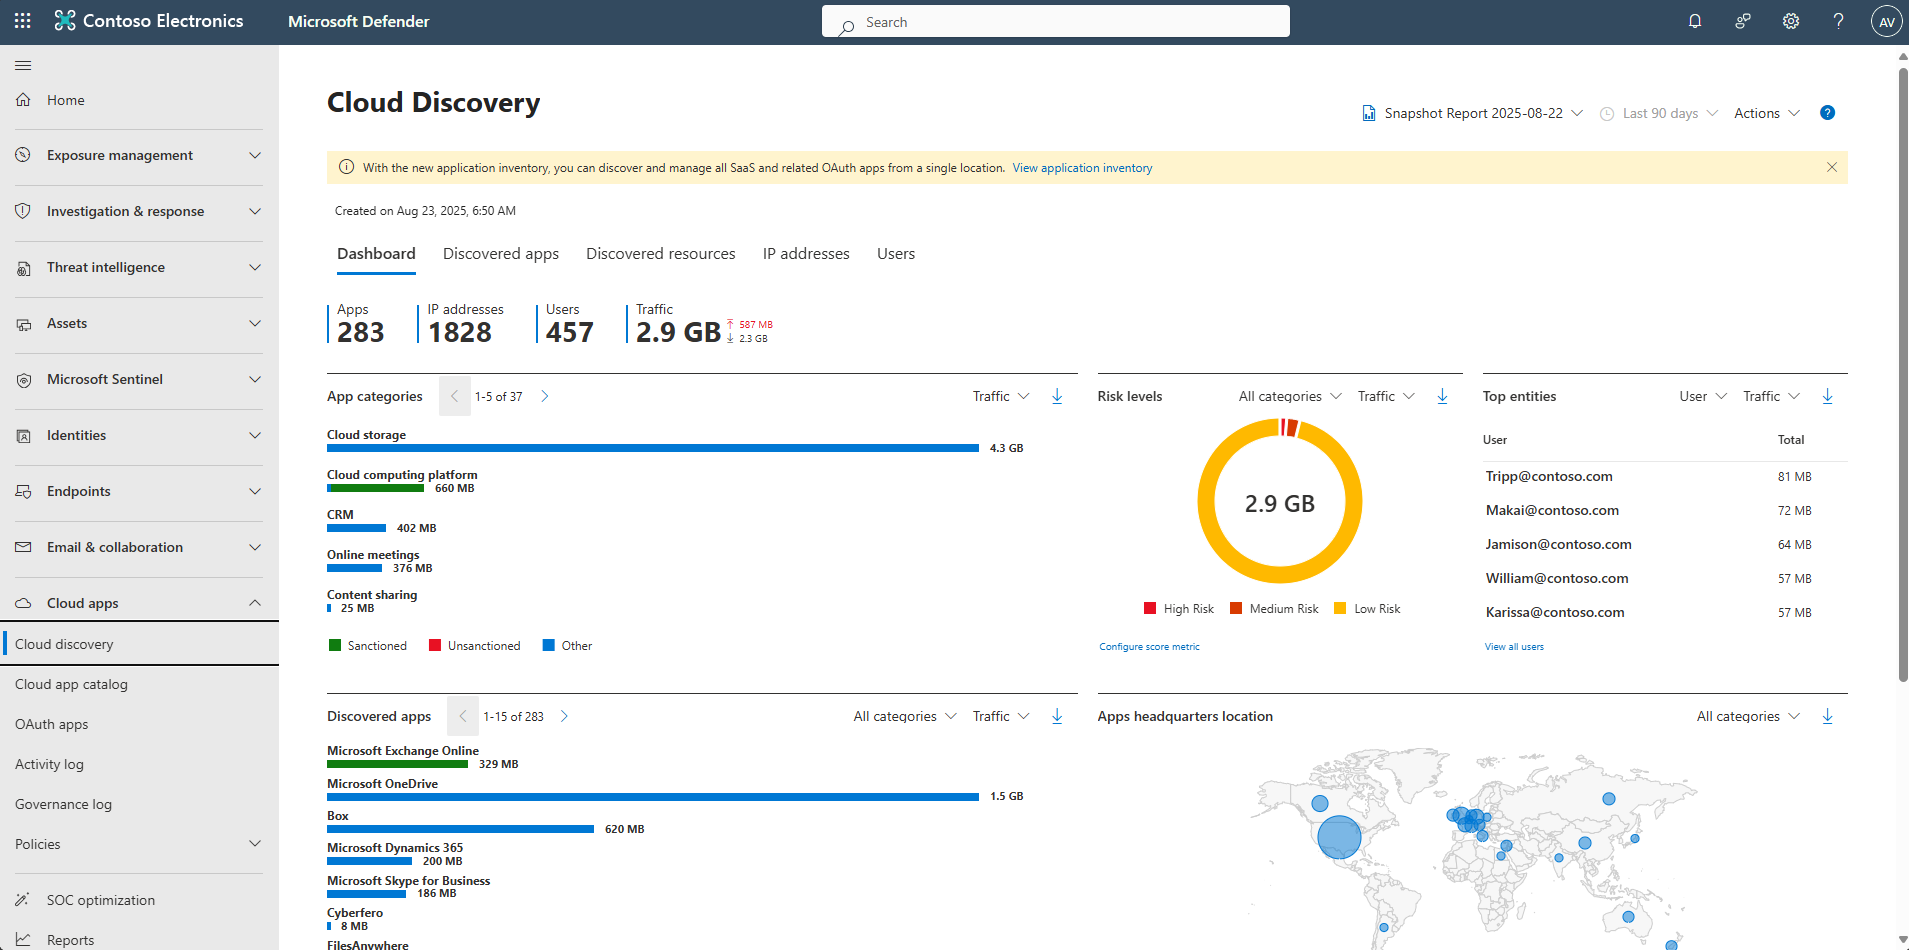
In the leftmost pane, select Cloud apps, then Cloud discovery.
-
Review discovered applications and governance alerts.
-
-
On the leftmost pane, select Microsoft Sentinel.
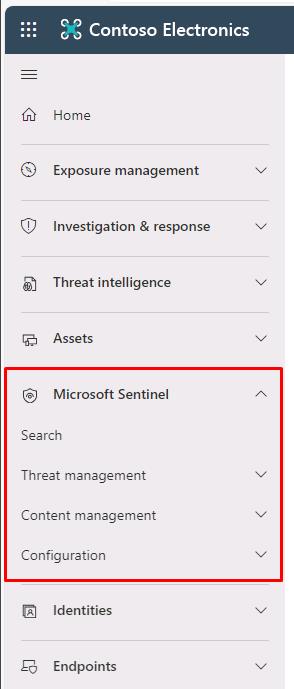
Sentinel now appears inside Defender. For this session, focus on XDR, but confirm Sentinel health here and you can also review the connected data sources (Data Connectors) under Microsoft Sentinel > Configuration >Data Connectors for any logs being collected.