Task 02: Check for degraded services and incidents from the last 24 hours
Check service health, warnings, and incidents across your environment.
-
Look for in-product warnings in the portal.
Expand here to confirm degraded services and warnings
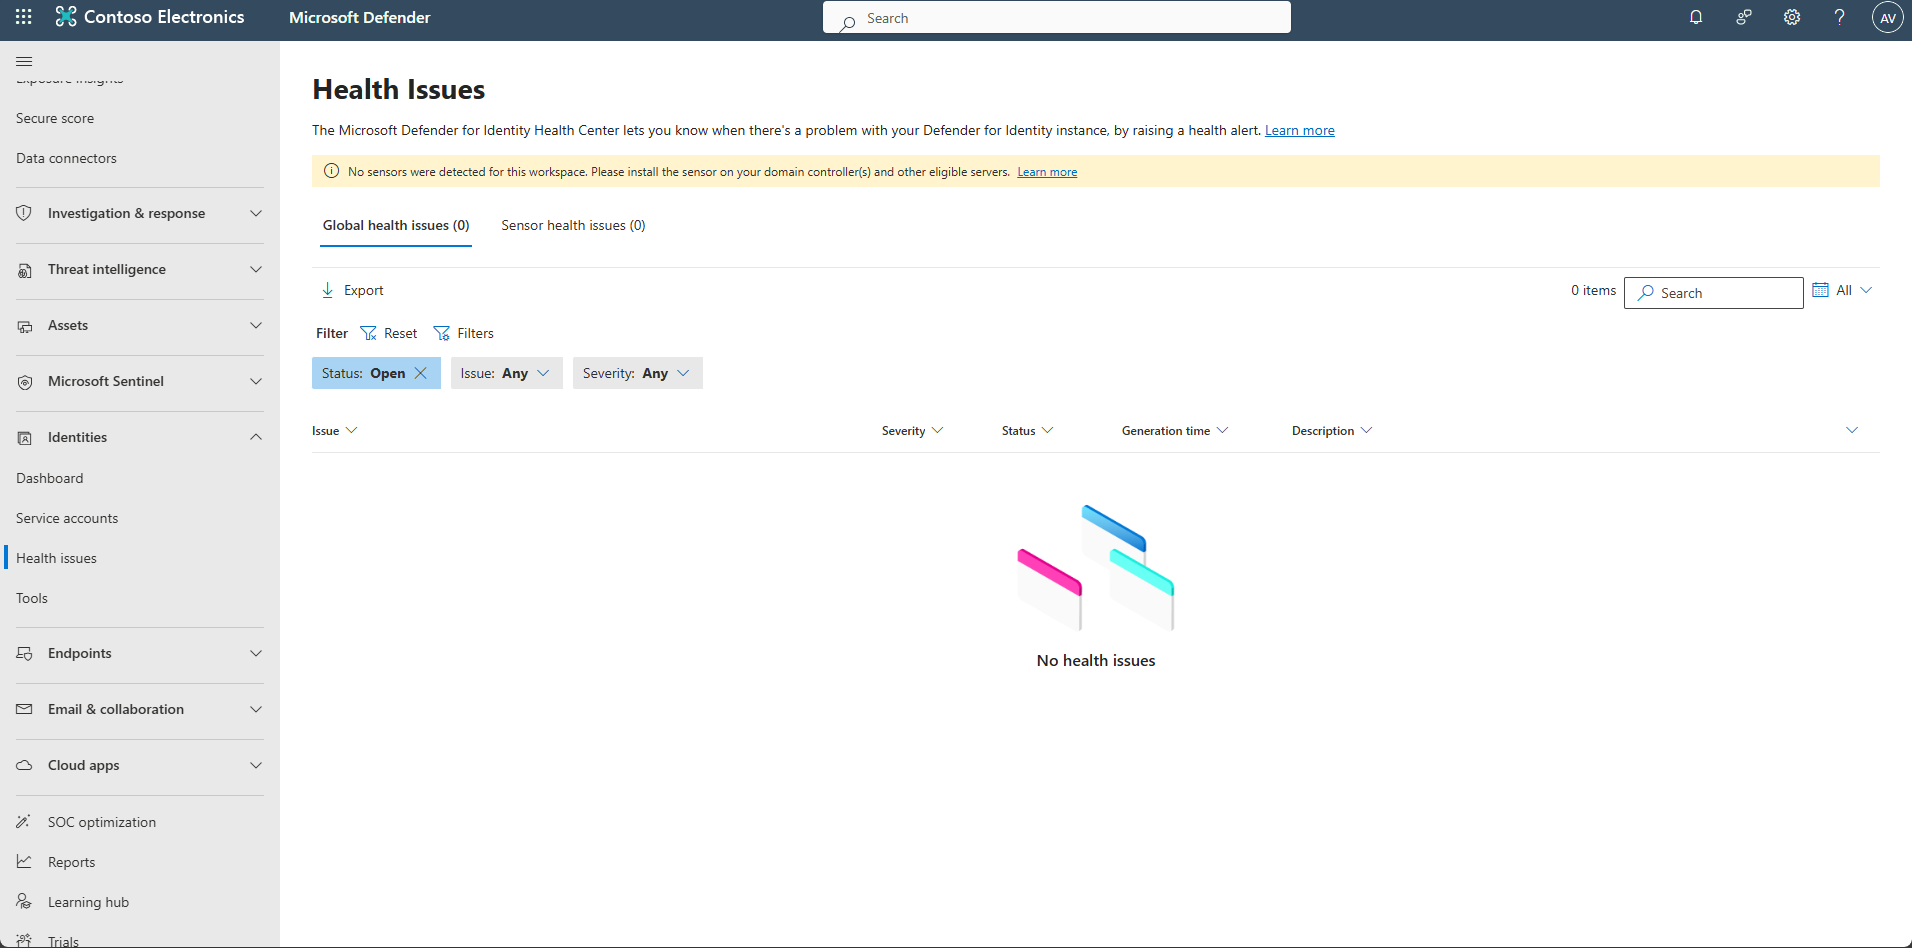
- On the leftmost pane, select Identities > Health issues.
- Review the top banner and left navigation for component-specific warnings (for example, Endpoint sensors or Email protection). These link to related health views.
-
Confirm Microsoft 365 service health.
Expand here to check Microsoft 365 service health
- Open a new tab and go to M365 Admin Center.
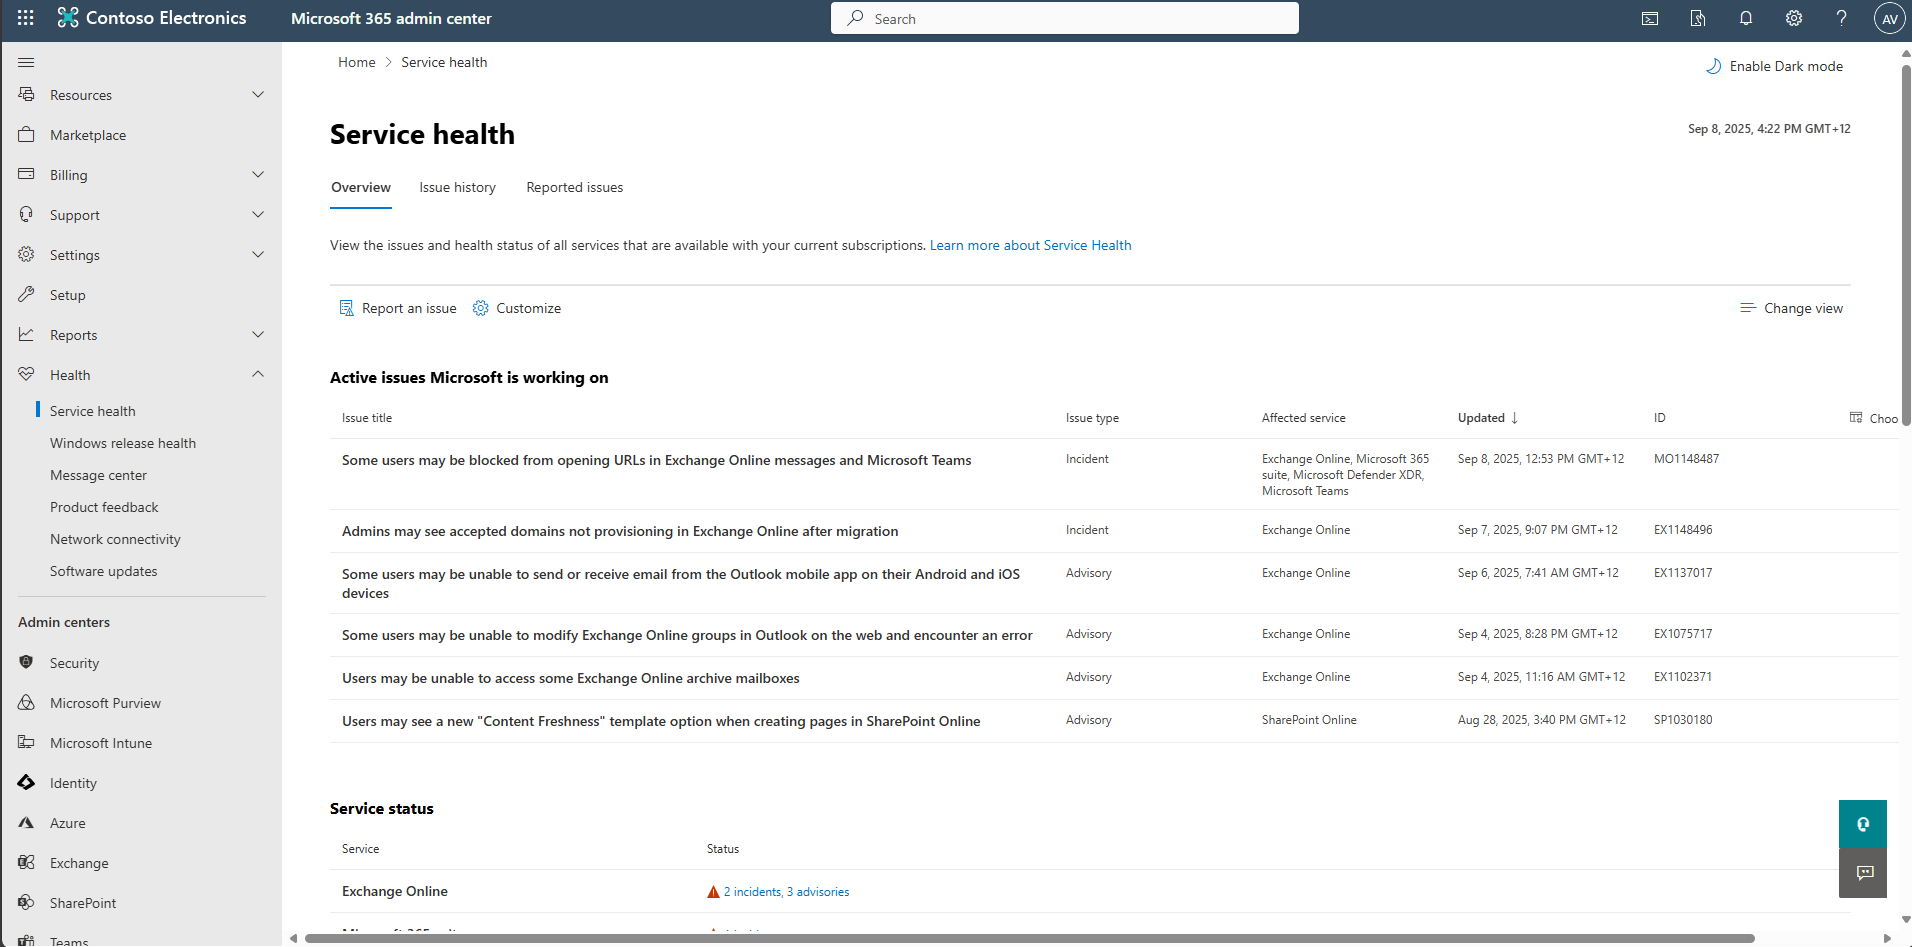
- In the leftmost pane, select Health > Service Health.
If needed, select Show all to display the Health category.
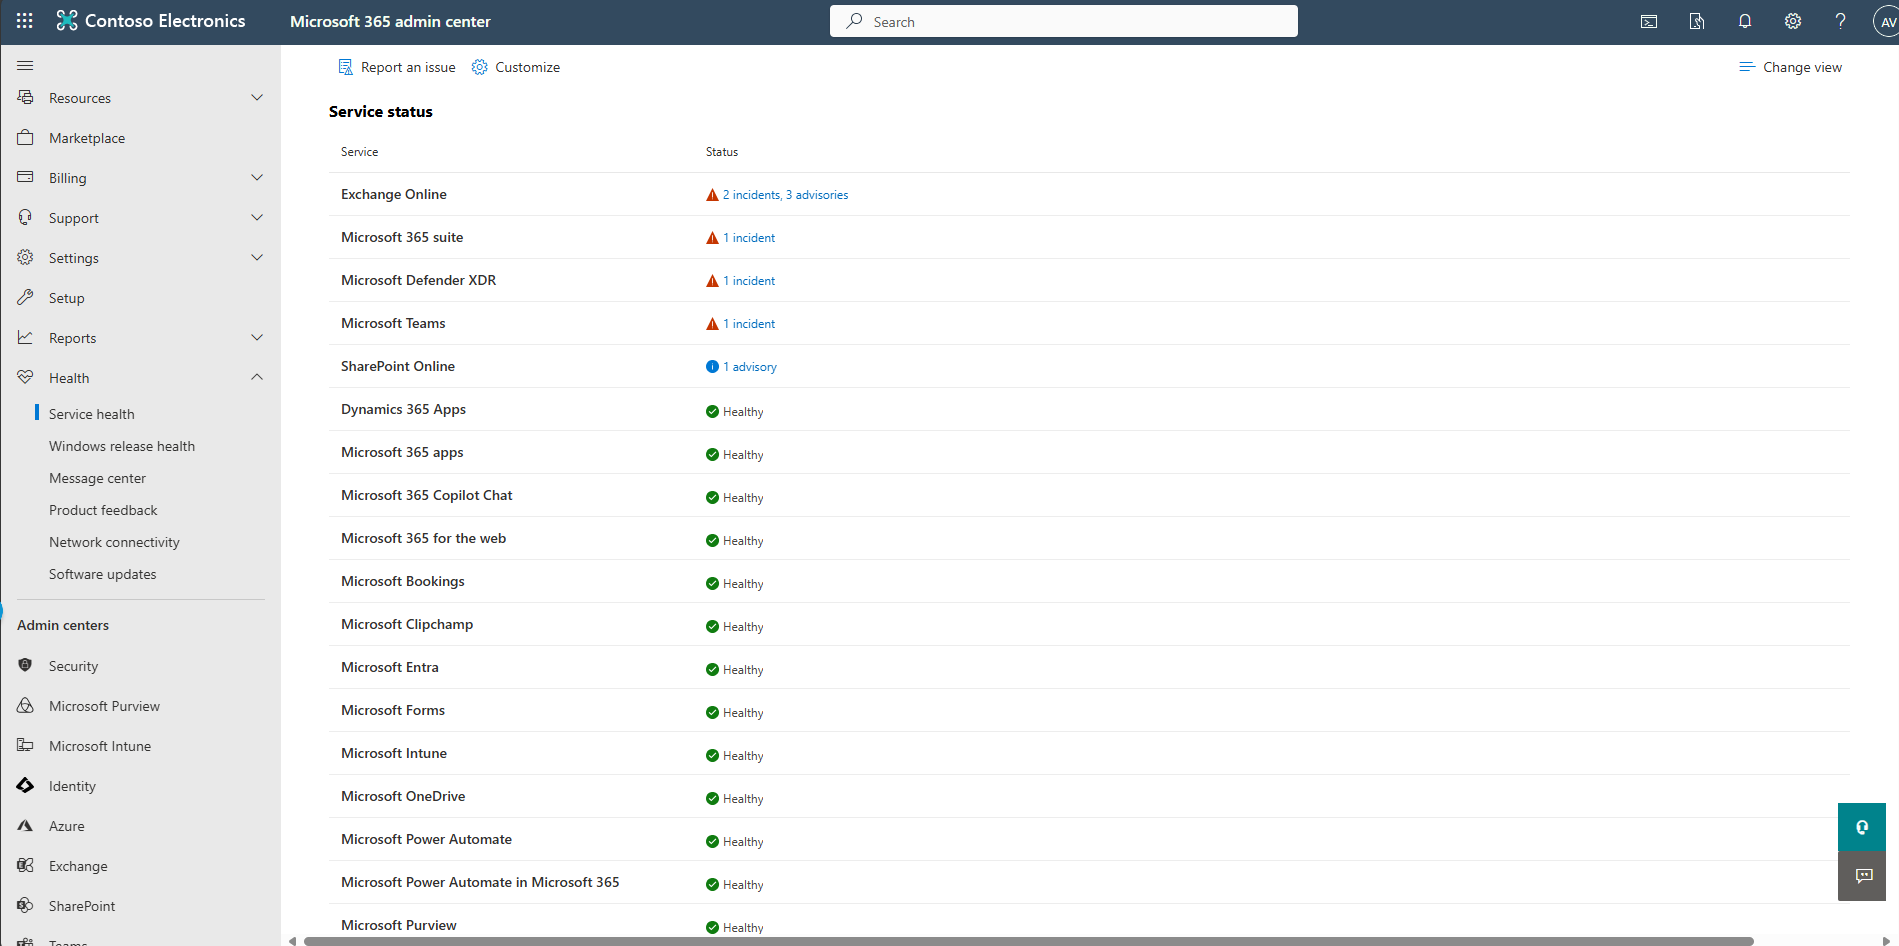
- Review any tenant-wide outages or advisories (Exchange, SharePoint, Teams, Entra ID).
-
Return to the browser tab that is signed into Microsoft Defender.
-
Select Investigation & response > Incidents & alerts > Incidents.
-
Set the time filter to 1 Day.
-
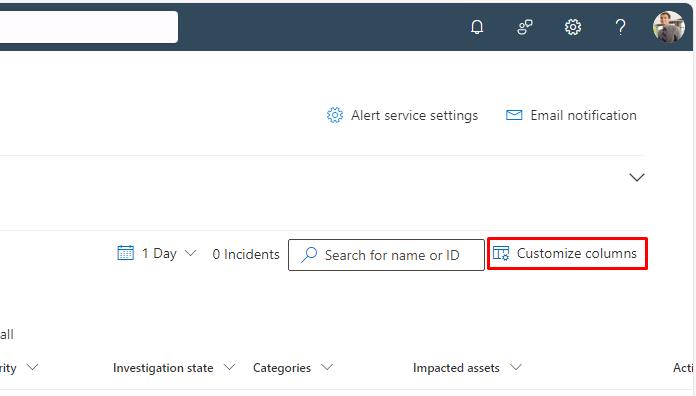
Near the upper-corner of the table, select Customize columns.
-
Select the following, if not already selected:
- Severity
- Categories
- Detection sources
- Last update time
- Status
- Assigned to
-
Sort by Last update time (descending) by selecting the column header, then by Severity.
Sorting this way surfaces the most critical issues first.
-
Access the alert timeline within the Incident queue by clicking on the ‘Most recent incidents and alerts arrow’ in the top right corner.
