TIP
💡 Learn more : Azure Monitor Capabilities (opens new window).
📺 Watch the video : How to use Azure Monitor Insights to record custom events (opens new window).
# Use Azure Monitor to track custom events
When you enable Insights (opens new window) in your application, you automatically start tracking application usage, performance, failures and more. This is great information that helps you to keep your application up and running and preforming well.
But sometimes you need more information. For instance, when you've just released a new feature, you want to know if users are using it and if that works for them. Insight scan help you to track this information as well. You do that by talking to the Insights API that you can access through the SDK.
NOTE: The following examples demonstrate adding the Insights SDK for .NET, but versions are also available for Node.js and Java
If you don't have the Insights SDK in your application yet, you can add it easily from within Visual Studio. Just right-click you project > Add > Insights Telemetry and go through the wizard.
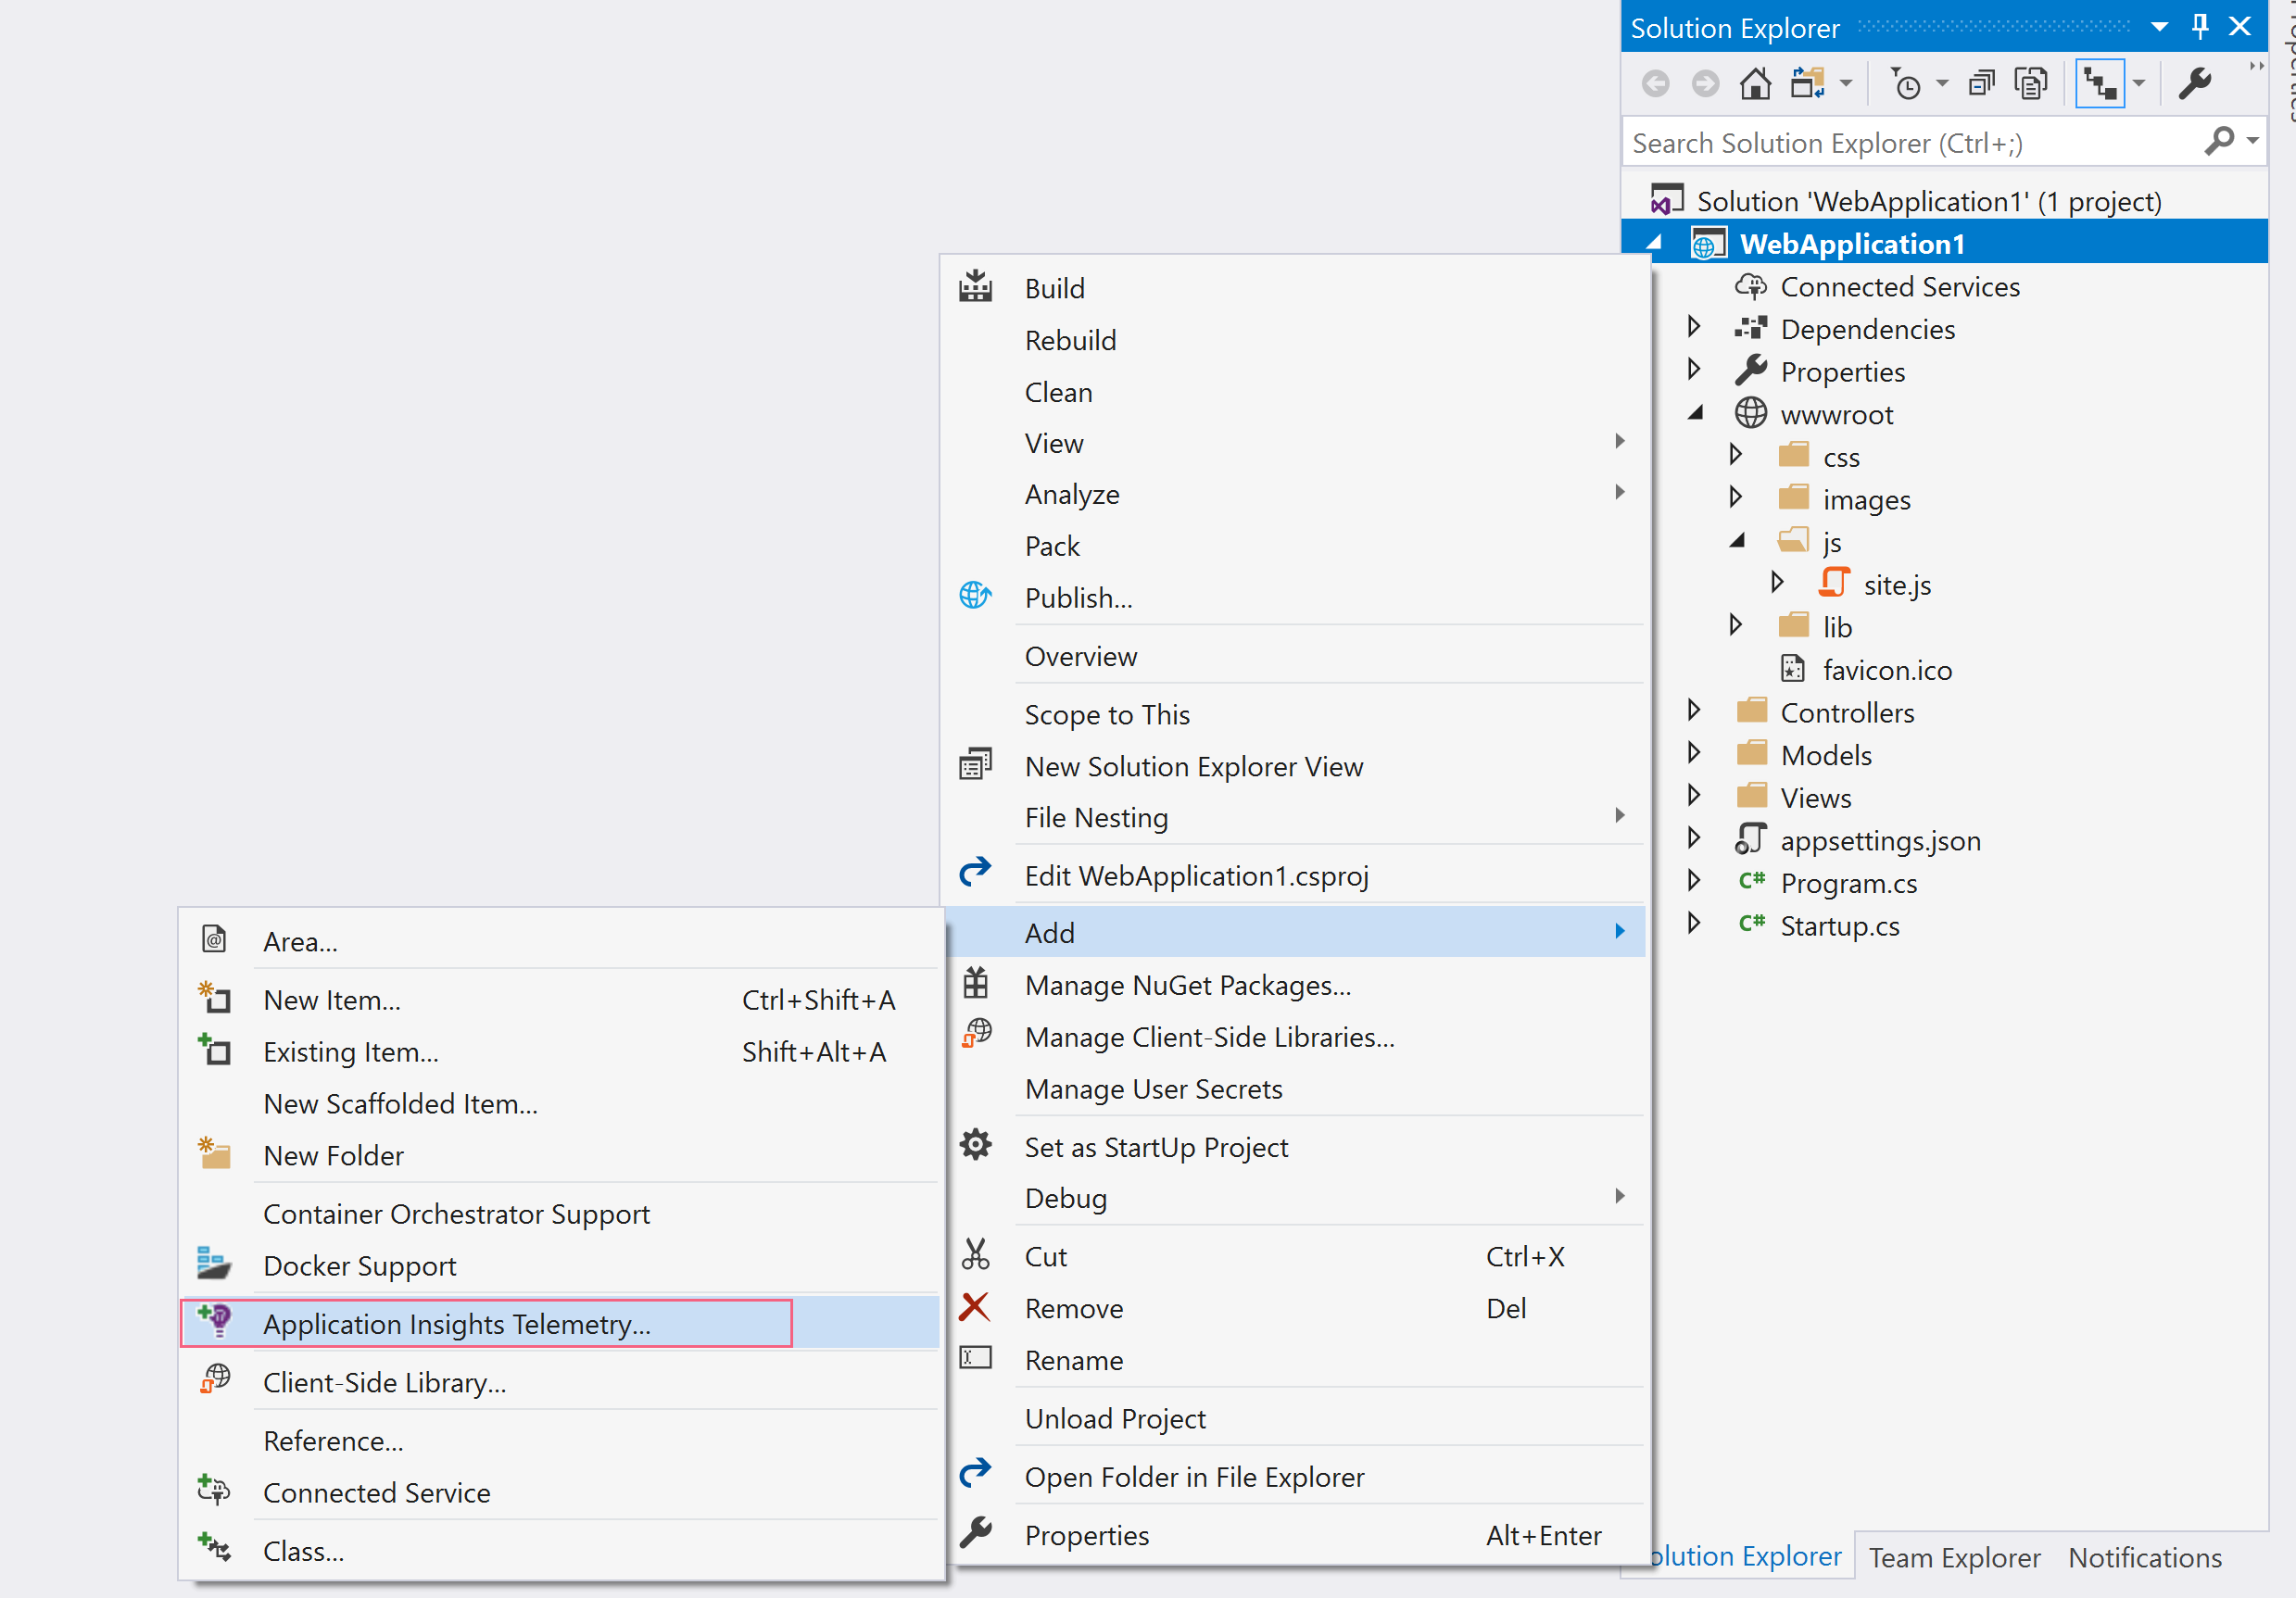
(Add the Insights SDK)
If you do have the SDK already, make sure that you've updated it to the latest version. You can do this in the NuGet Package Manager.

(Update the Insights SDK)
Let's take a look at how we can track some custom events with Application Insights.
# Log custom server-side events using the Insights C# SDK
Logging custom events is very simple when you use the SDK.
The first thing that you need to do is get a reference to the telemetry client, like this:
private TelemetryClient telemetry = new TelemetryClient();
Now use the client to log events. There are several methods that you can use to log custom data. For things that happened, the TrackEvent call works best. Other methods (opens new window) that you can use are TrackException, TrackRequest and TrackDependency, amongst others. In my case, I want to track the search terms that people use in my application. I can do that like this:
var dictionary = new Dictionary<string, string>();
dictionary.Add("term", searchterm);

telemetry.TrackEvent("Searched", dictionary);
2
3
4
You provide the TrackEvent method with a dictionary. Because of this, you can provide it with a whole list of key/value pairs.
# Log custom client-side events using the Insights JavaScript SDK
I also want to track events that happen on the client. In JavaScript, I execute a method when a user clicks on a certain div element. I want to know which div this is. To track events on the client, you use the Insights JavaScript SDK. This is automatically injected for you on each page when you enable Application Insights.
In JavaScript, I just call trackEvent on the appInsights object to track the event.
var dictionary = { "service": serviceName };
window.appInsights.trackEvent("ServiceClick", dictionary);
2
I can do this, without first getting a reference to the Insights client, because the client is already injected for me. And also here, I pass the trackEvent method a dictionary with values.
# Analyzing custom events
Now that we are logging custom events, we can also see them in Insights in the Azure portal.
In the portal, in your Insights instance, you can see the events in the Events menu.
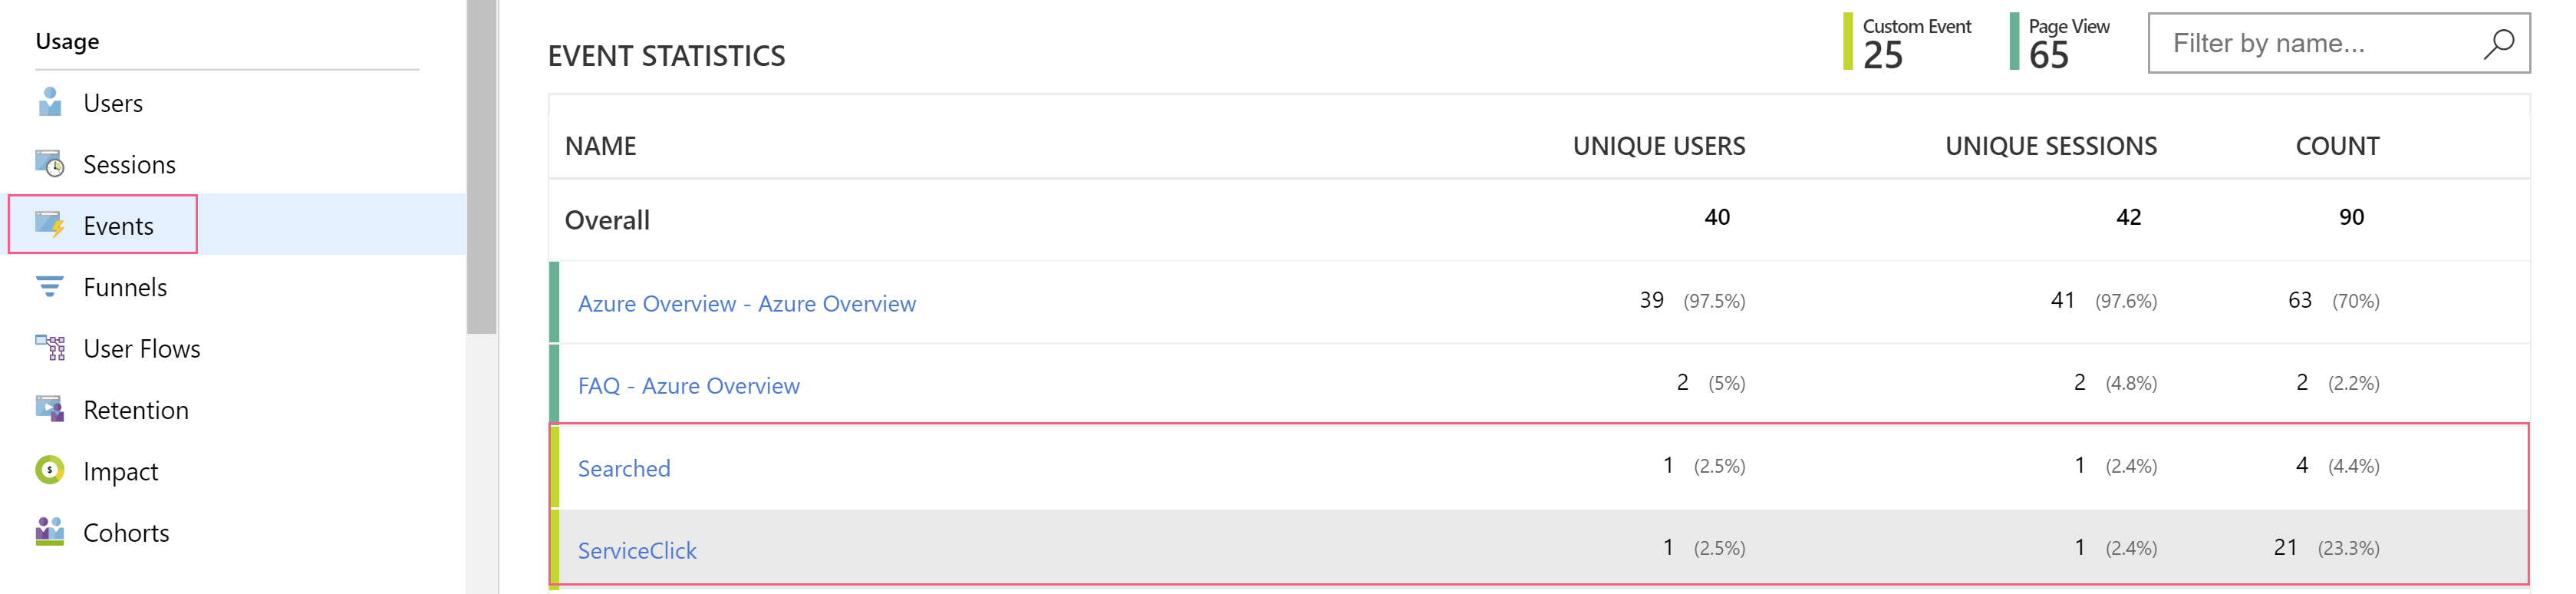
(Insights Events in the Azure portal)
In the events page, you can see an aggregate table of which custom events happened and how many times they happened. From here, you can drill down into the events to take a closer look at their data. You can see each individual event and see which data is associated with the event.
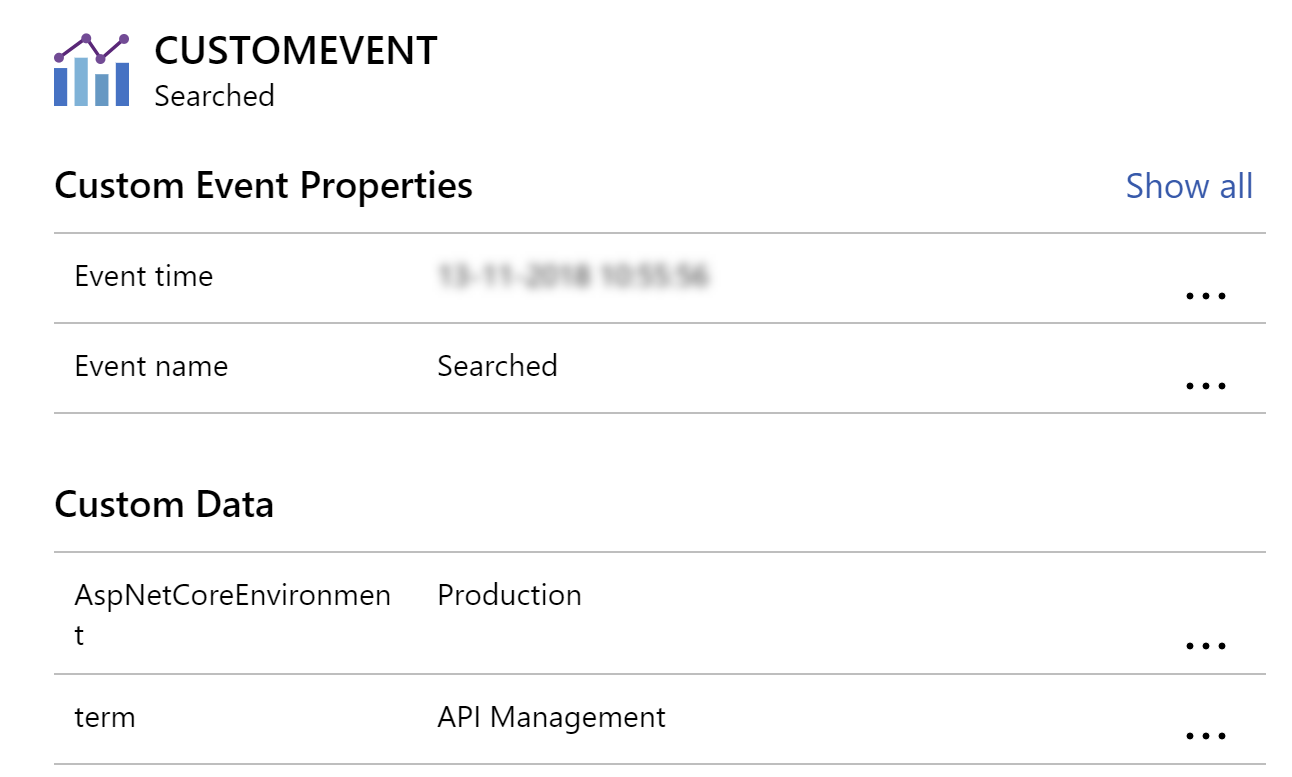
(Custom event data in the Azure portal)
If you want to dive in deeper, you can query all of your data, including the custom events, using the Insights Analytics portal.
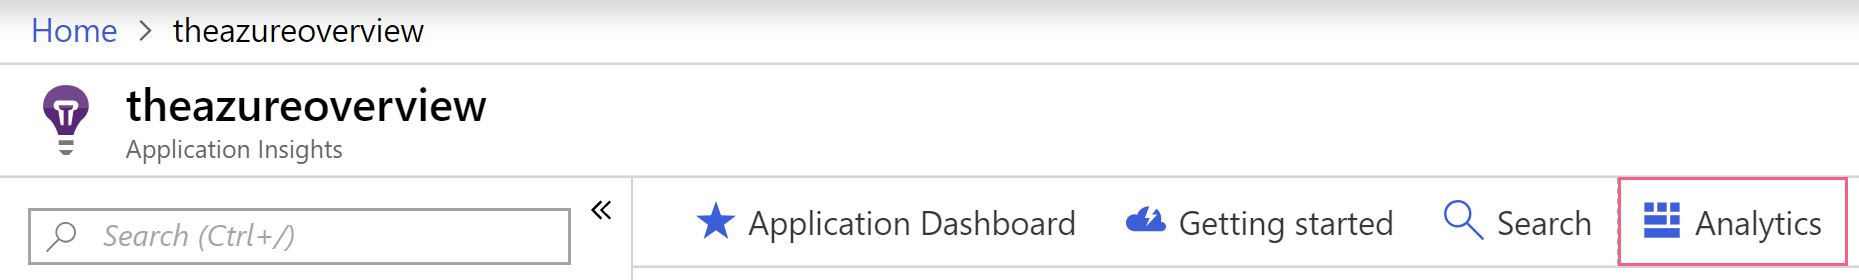
(The Analytics button in Application Insights)
In here, you can query the data. This is very powerful and allows you to display the results as data or even render it in a chart. You can query the data using a SQL-like language, which is pretty simple to use and there's good documentation on the query language. The portal provides you with all of the fields that you can query on and you can use common constructs like "where" clauses in your queries.
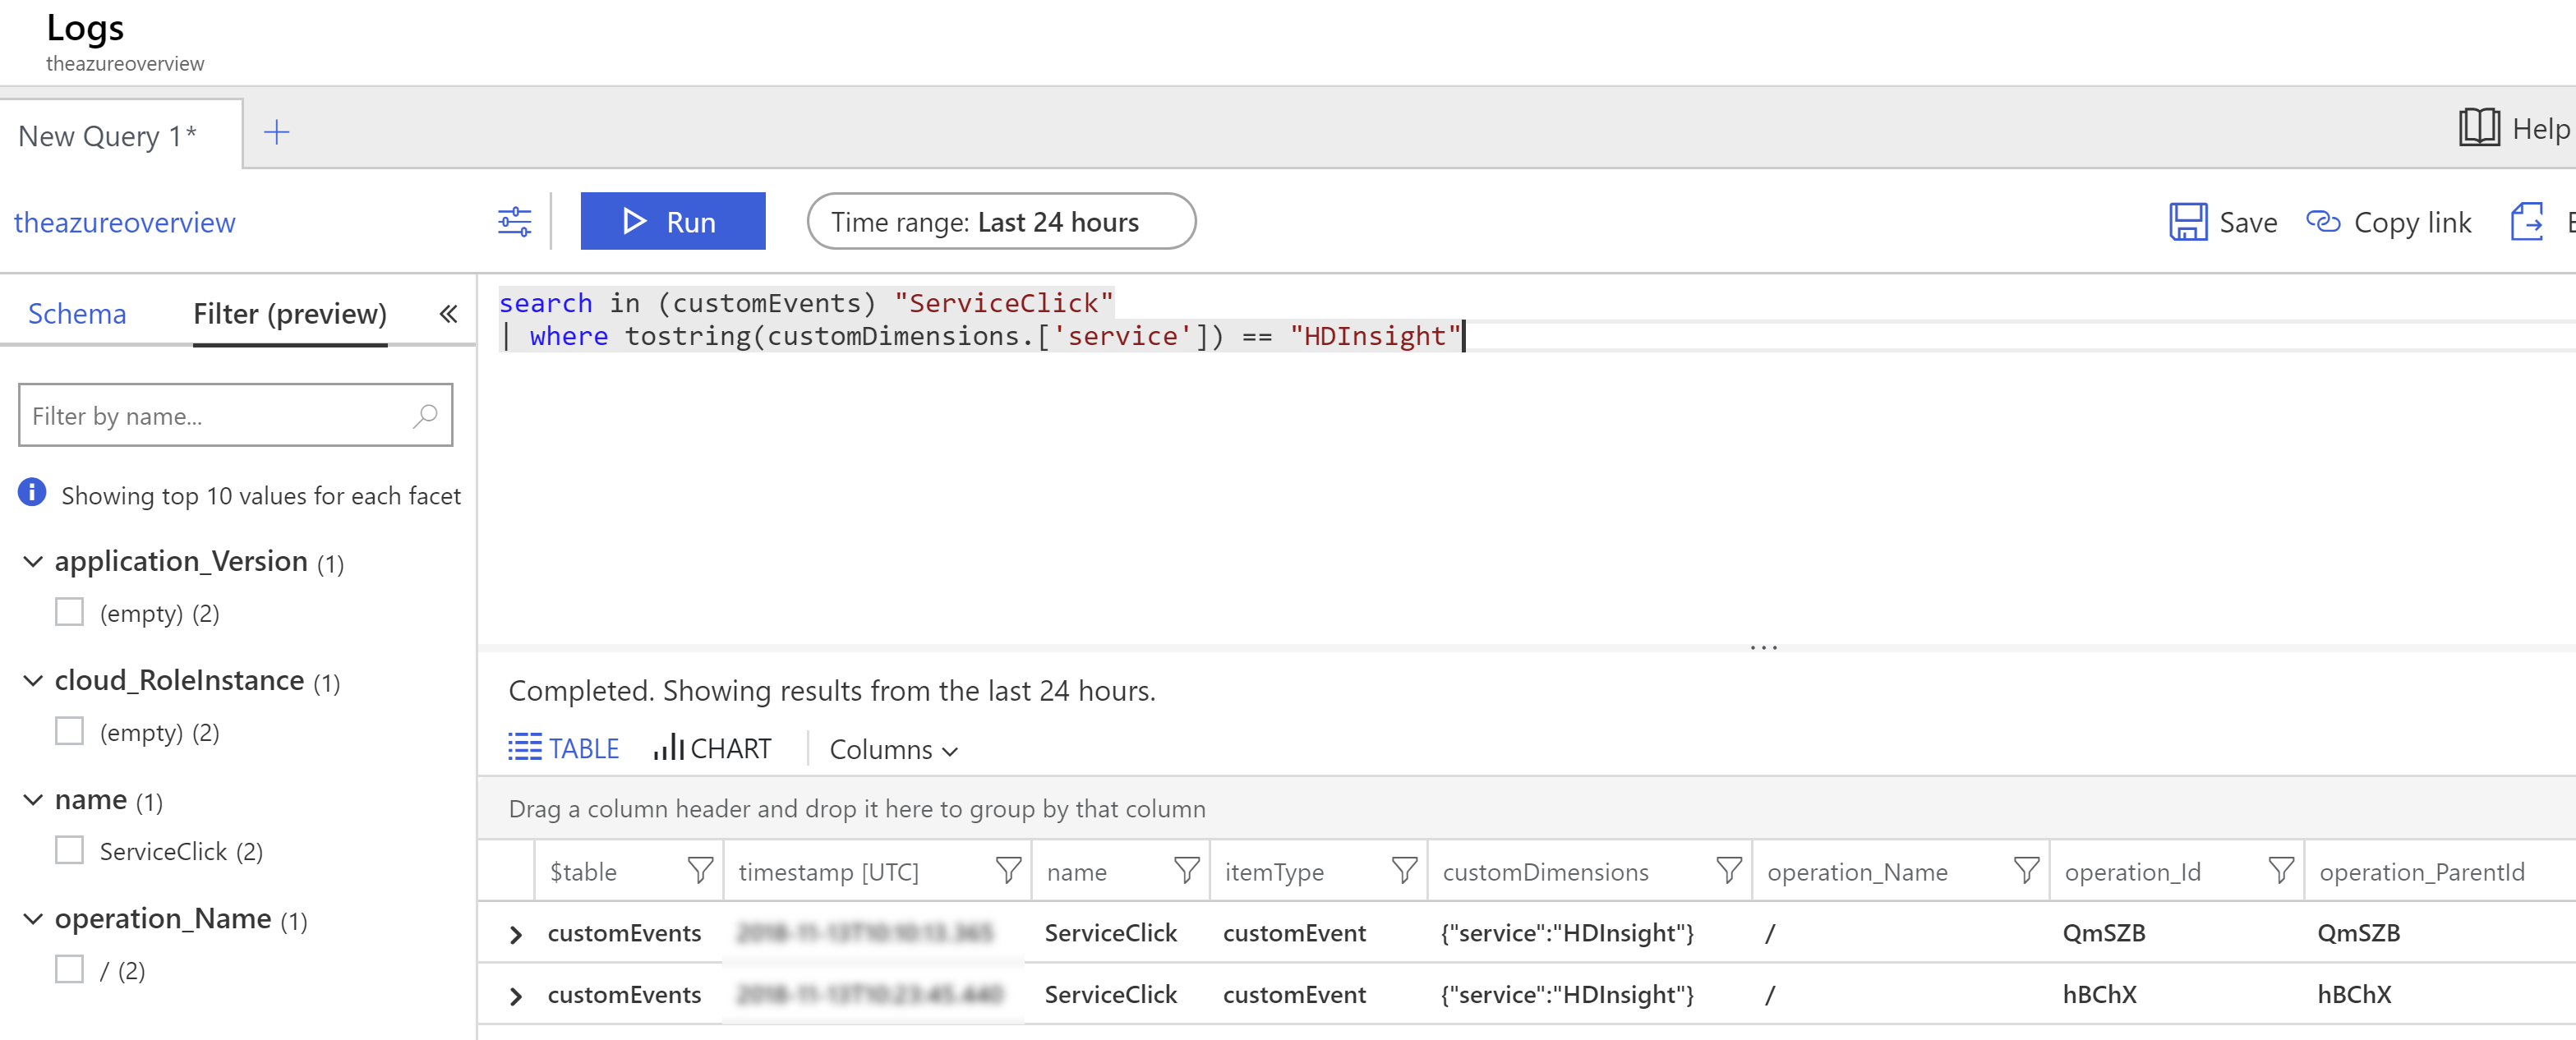
(Query custom events in Insights Analytics)
# Conclusion
Logging custom data with Insights is very easy. You can track things that happen and you can also track metrics, like the http queue length performance metric. Insights in the Azure portal allows you to easily analyze this custom data and even render charts from it.
As all of this is relatively easy, you owe it to yourself to track what your users are doing. That's the only way to know if your application is actually being used in the way you thought it would. Go and check it out!