TIP
🔥 Download the FREE Azure Developer Guide eBook here (opens new window).
💡 Learn more : How to integrate Azure API Management with Application Insights (opens new window).
💡 Learn more : Performance implications and log sampling (opens new window).
This post was brought to you by Abishek Narayan (opens new window).
# How to log request/response payload in Application Insights for APIs frontend by API Management
# Need for debugging/troubleshooting request/response payloads
When fronting your APIs with an Azure API Management Gateway (opens new window) there is often a need to debug/troubleshoot issues by analysing the request or response payload. In such a scenario we use Application Insights (opens new window) to log and inspect the request/response payloads. To avoid performance issues at API Management level, the configuration to inspect payloads is not enabled by default.
# Prerequisites
If you want to follow along, you'll need the following:
- An Azure subscription (If you don't have an Azure subscription, create a free account (opens new window) before you begin)
- Postman (opens new window) to trigger the sample API
- A provisioned API Management resource (opens new window)
- An API (with a POST operation), deployed to Azure (optional) and frontend by API Management (opens new window)
- An Application insights resource integrated with API Management (opens new window)
- For analyzing logs
- Basic understanding of Log Analytics (opens new window)
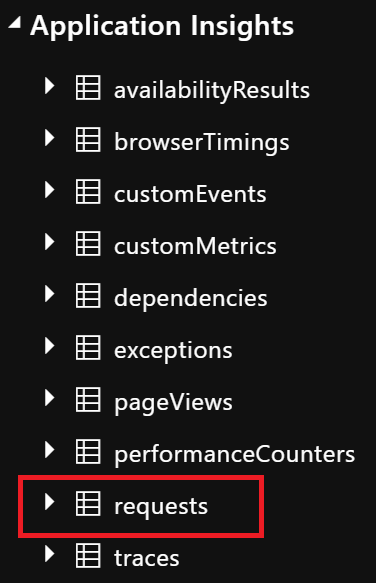
- Basic understanding of querying Application Insight tables (we will use the 'response' table)

# Steps
- Go to the Azure portal (opens new window) and navigate to the API Management resource
- Under Settings >> select API
- Select the sample API from the right pane
- Click the 'Settings' tab
- Scroll down to Diagnostics Logs
- Under Application Insights tab, tick the checkbox Enable
- Select the AppInsights resource under Destination dropdown
- Default sampling 100%
- Verbosity Information
- Correlation protocol W3C
- Under Additional settings click Advanced Options
- Tick to enable Frontend Request and Frontend Response
- Use these settings for Frontend Request and Frontend Response
- Under Headers to log add the value X-Forwarded-For
- Under Number of payload bytes to log (up to 8192) specify a value upto 8192 bytes
- Hit save
- Navigate to the application insights resource and open the 'Live Metrics' feature under Investigate.
- Once the metrics have been initialized, open Postman and trigger the POST operation for the API with a sample payload. You should see a spike in the 'request rate' graph
- Wait for a few minutes, under Application Insights>>Monitoring>>Logs run the following query
requests
| where url == "http://apimanagementurl/apiname/resource"
| where timestamp >= ago(1h)
| order by timestamp desc
2
3
4
5
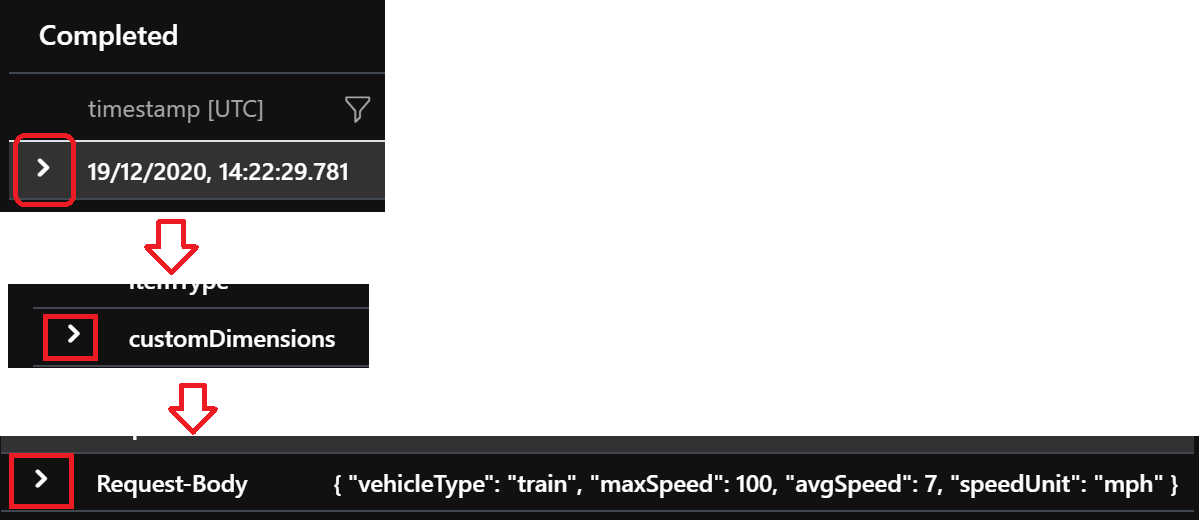
- In the results grid, expand the result row, expand the customDimensions node and then expand the Request-Body node.

Thanks to Todd Foust (opens new window) for sharing the header value.
