TIP
💡 Learn more : App Service Documentation (opens new window).
# Using Application Insights with Azure App Service
Application Insights is a simple way to detect and diagnose exceptions and application performance issues in your web apps and web services. In this blog post, I'll walk you through adding it to an ASP.NET MVC application.
In order to take advantage of this, you'll need to log into your Azure account and go to your App Service that you created and look under Monitoring then you will see Application Insights. Open it and create a new resource and press OK as shown below.
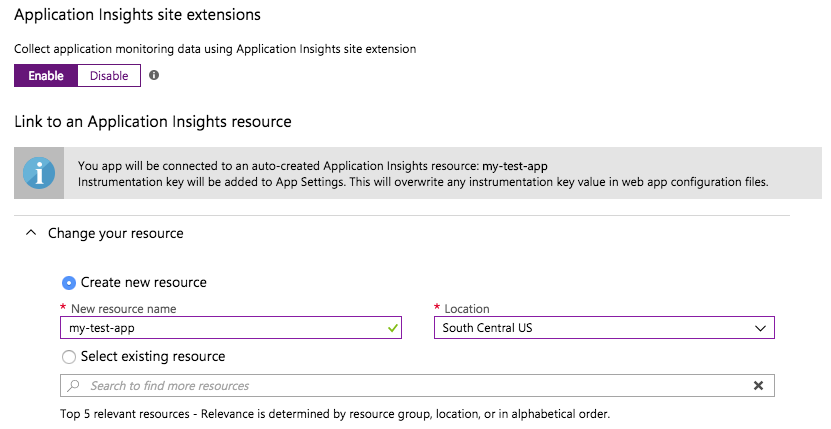
It will bring you to a page with no data but will present you with the following prompt:
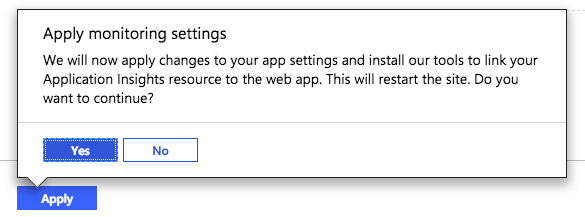
You'll see that you can automatically instrument your ASP.NET app with a restart. Yes, please. Go ahead, and click on the orange banner to restart your app.
Once complete, go and visit your app and refresh a couple of times and then go back and take a look at the live stream. I've included a sample below:
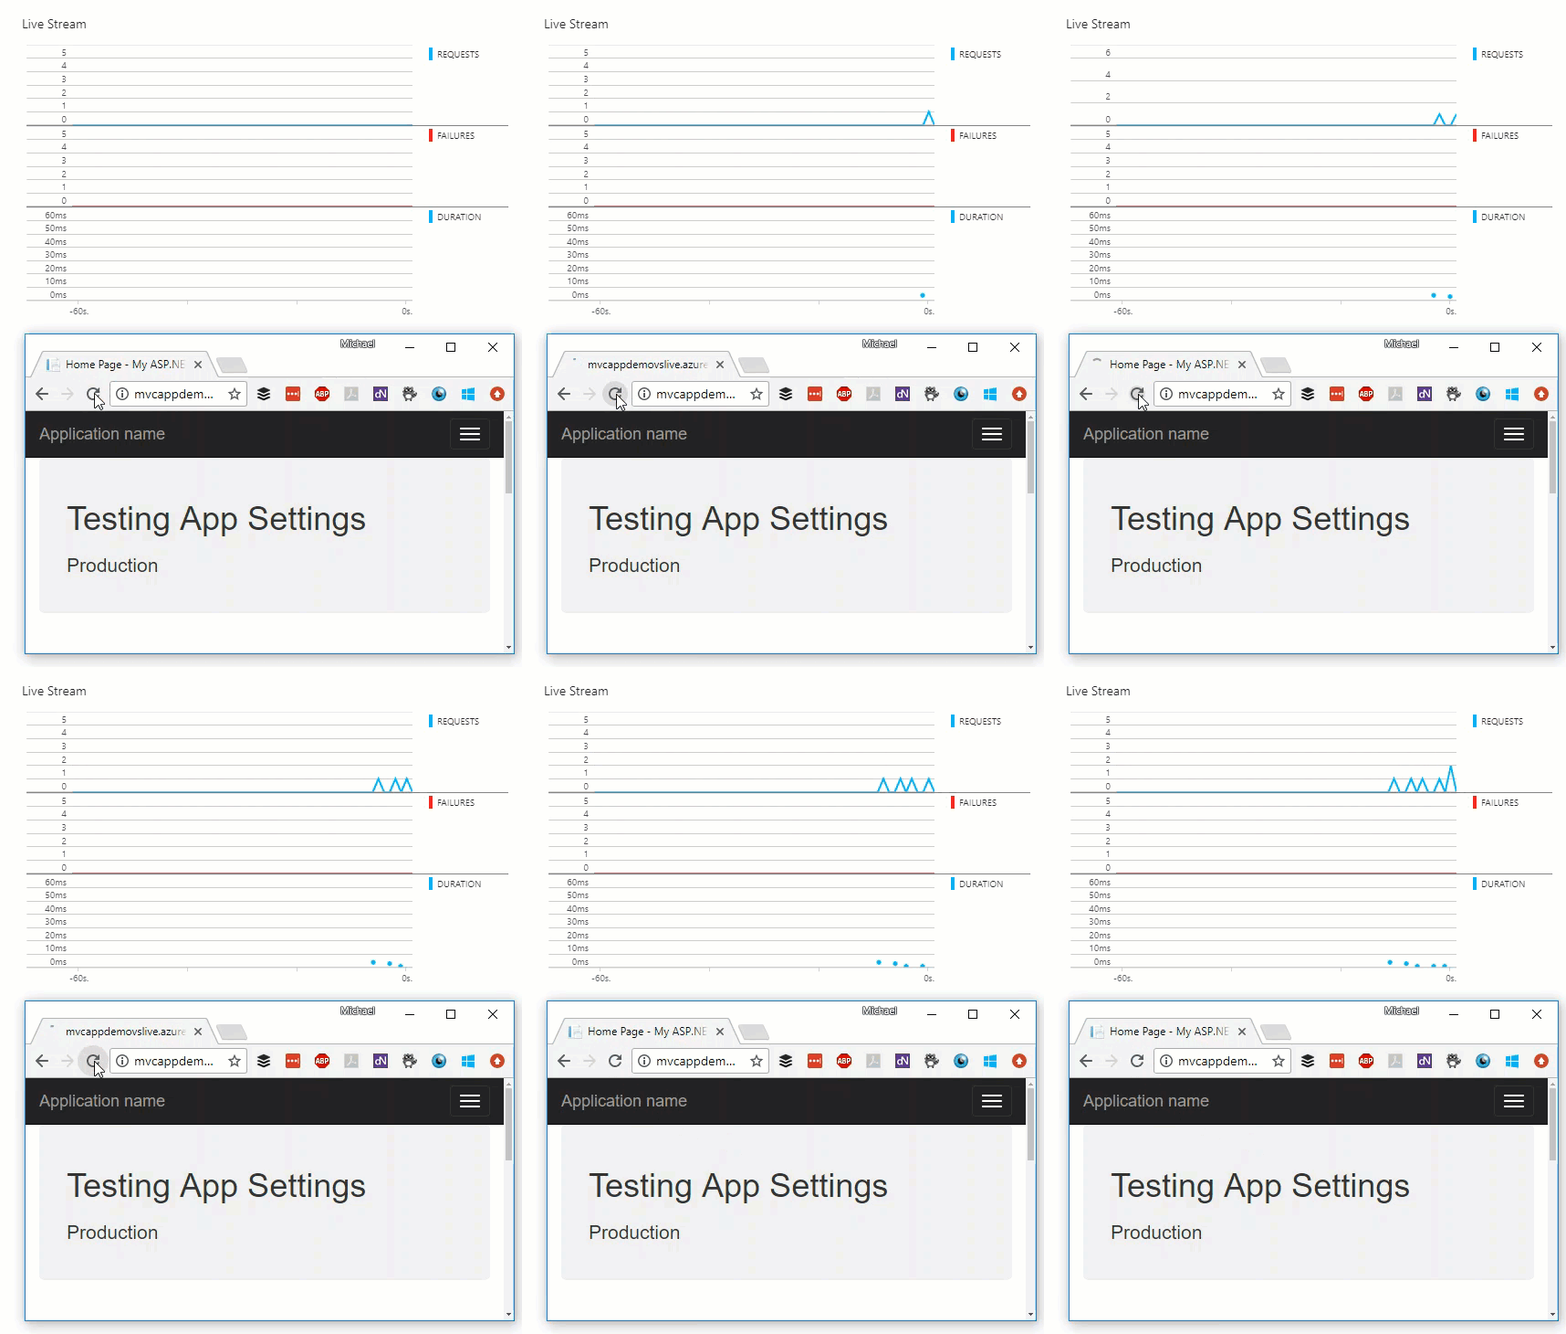
It is working as expected, but let's add an error into our application. Go to your appname/Controllers/HomeController.cs and add the following code:
public ActionResult ThrowNewError()
{
  throw new InvalidOperationException("The app just threw an error!");
}
2
3
4
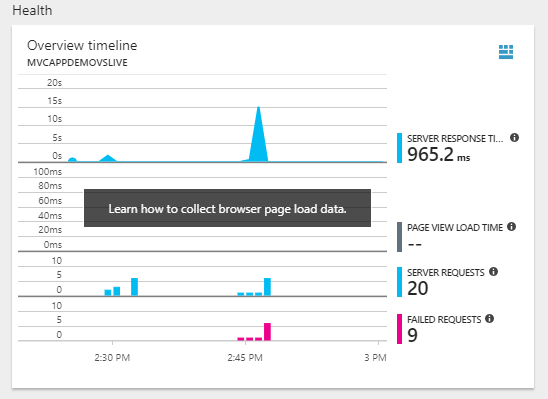
You'll need to go back to your site and depending on where you placed it, you can invoke the code by going to *.azurewebsites.net/Home/ThrowNewError. If you switch back over to Application Insights, then you'll see the errors are being reported.
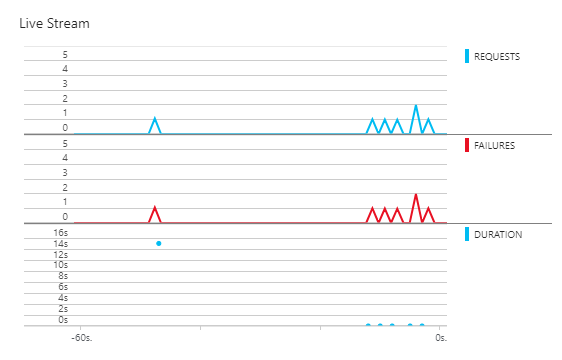
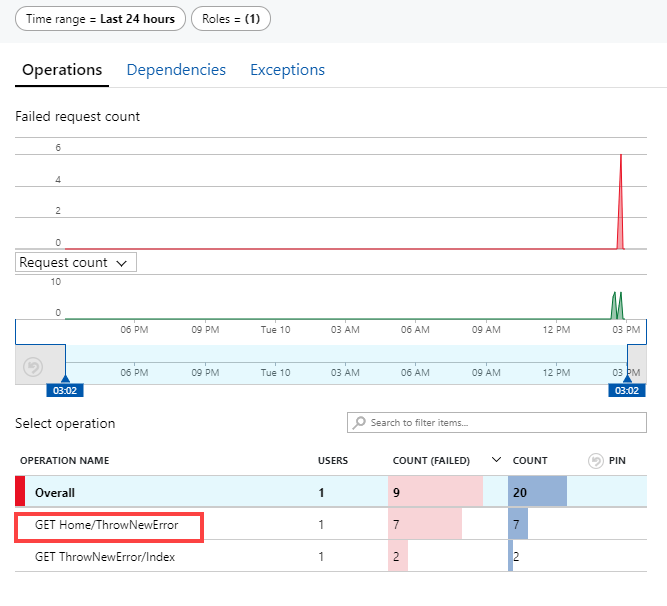
You can drill deeper down by clicking on Open in Application Insights. From here you can see how many Failed Request were reported.
You can even drill down on what URL was called to trigger the error.
If you add Application Insights to your Visual Studio project by right-clicking the project and then adding Configure Application Insights, then you can add code to collect exception telemetry. You can learn more about that by clicking here (opens new window).
