TIP
🔥 Make sure you star the repo (opens new window) to keep up to date with new tips and tricks.
💡 Learn more : Azure Resource Graph (opens new window).
📺 Watch the video : Write queries and create dashboards using the full power of Azure Resource Graph (opens new window).
# Write queries and create dashboards using the full power of Azure Resource Graph
# The Azure Resource Graph
Sometimes, it is difficult to gain insights into your cloud resources. Especially when they are scattered across many Azure subscriptions. Azure Resource Graph (opens new window) provides a solution for this. You can use it to query your resources in Azure across subscriptions. Azure Resource Graph is an API that you can use as a REST API (opens new window), from the Azure portal (opens new window) or from the Azure CLI (opens new window), Azure PowerShell (opens new window), and Azure SDK for .NET (opens new window).
You can do many things with the Azure Resource Graph, like searching for resources that expose IP addresses, or returning all VMs that run Linux. In this post, we'll explore how you can use the Azure Resource Graph from the Azure portal and how you can integrate its results in Azure portal dashboards. (opens new window)
# Prerequisites
If you want to follow along, you'll need the following:
- An Azure subscription (If you don't have an Azure subscription, create a free account (opens new window) before you begin)
# Azure Resource Graph Queries are first-class citizens in the new Azure portal
Let's explore how we can use Azure Resource Graph in the Azure portal.
- Go to the Azure portal (opens new window)
- In the search bar at the top, search for Azure Resource Graph.
- This brings up the Resource Graph Explorer. By the way, have you noticed that the results from the search bar also show links to documentation for the search results and other helpful resources?
- Click on the Resource Graph Explorer to open it
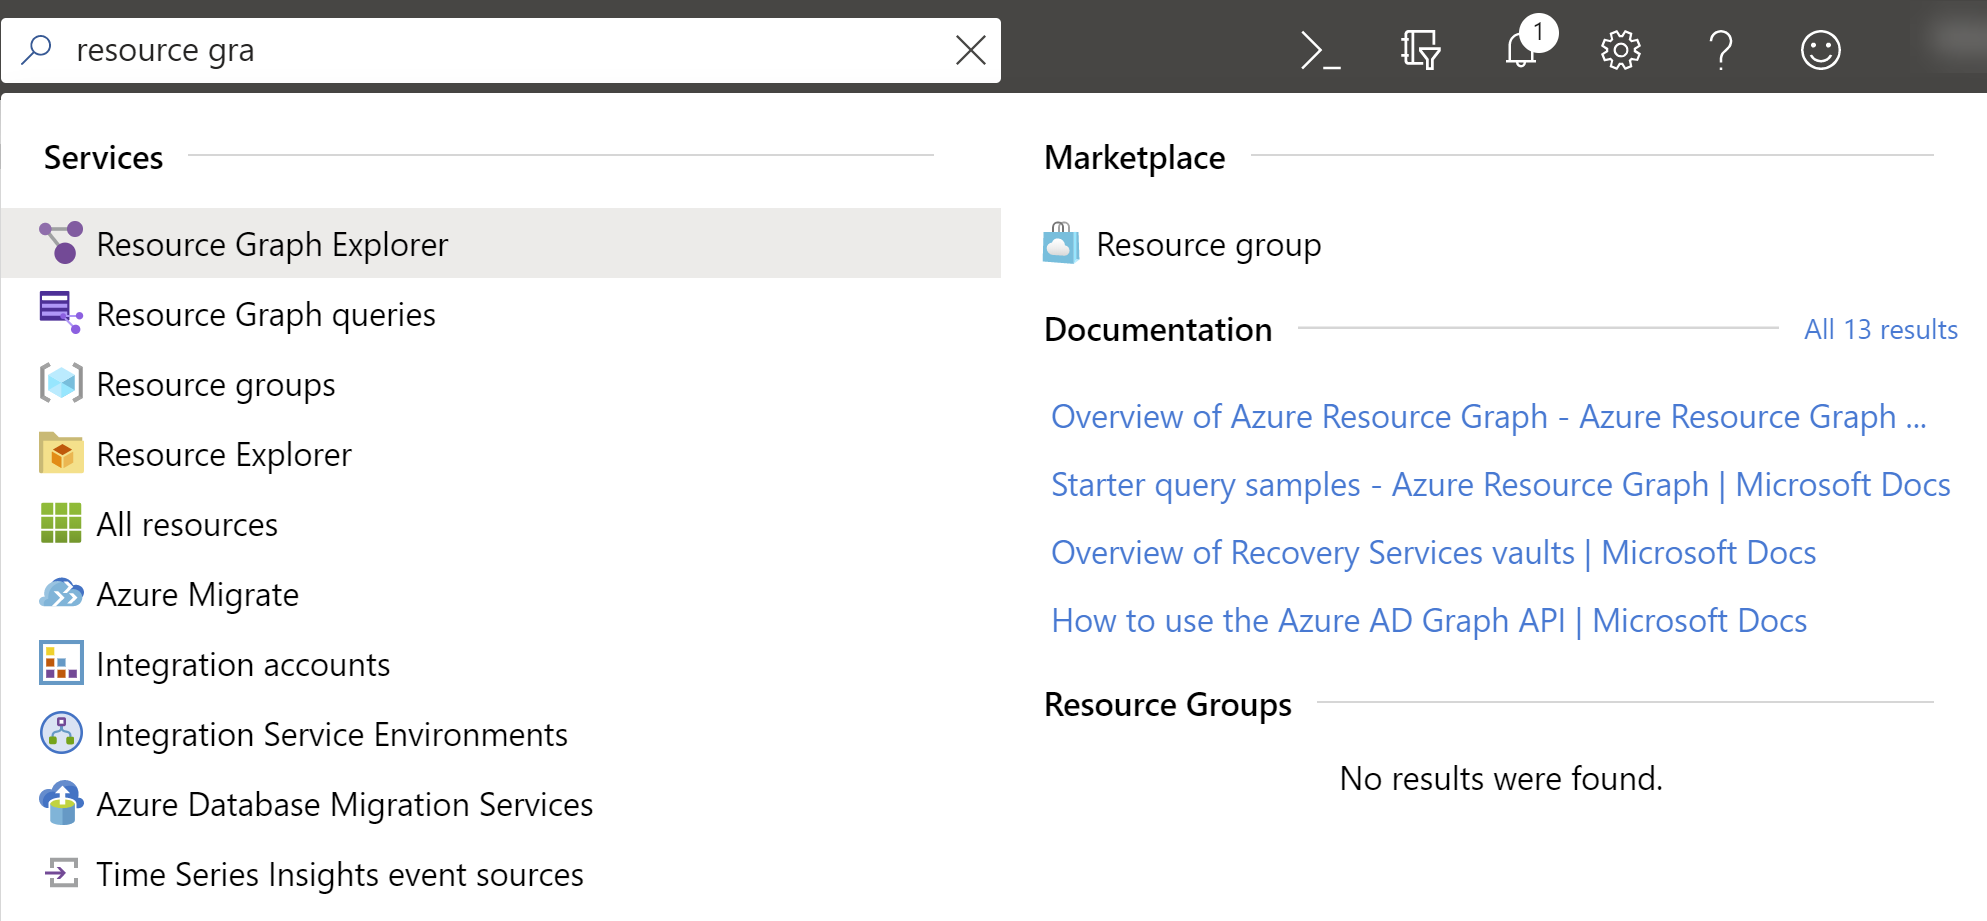
(Resource Graph Explorer in the search results)
You are now in the Resource Graph Explorer. From here, you can run Azure Resource Graph queries. You create these queries with the Kusto Query Language (KQL) (opens new window), which you also use to query Application Insights (opens new window) and Azure Monitor (opens new window).
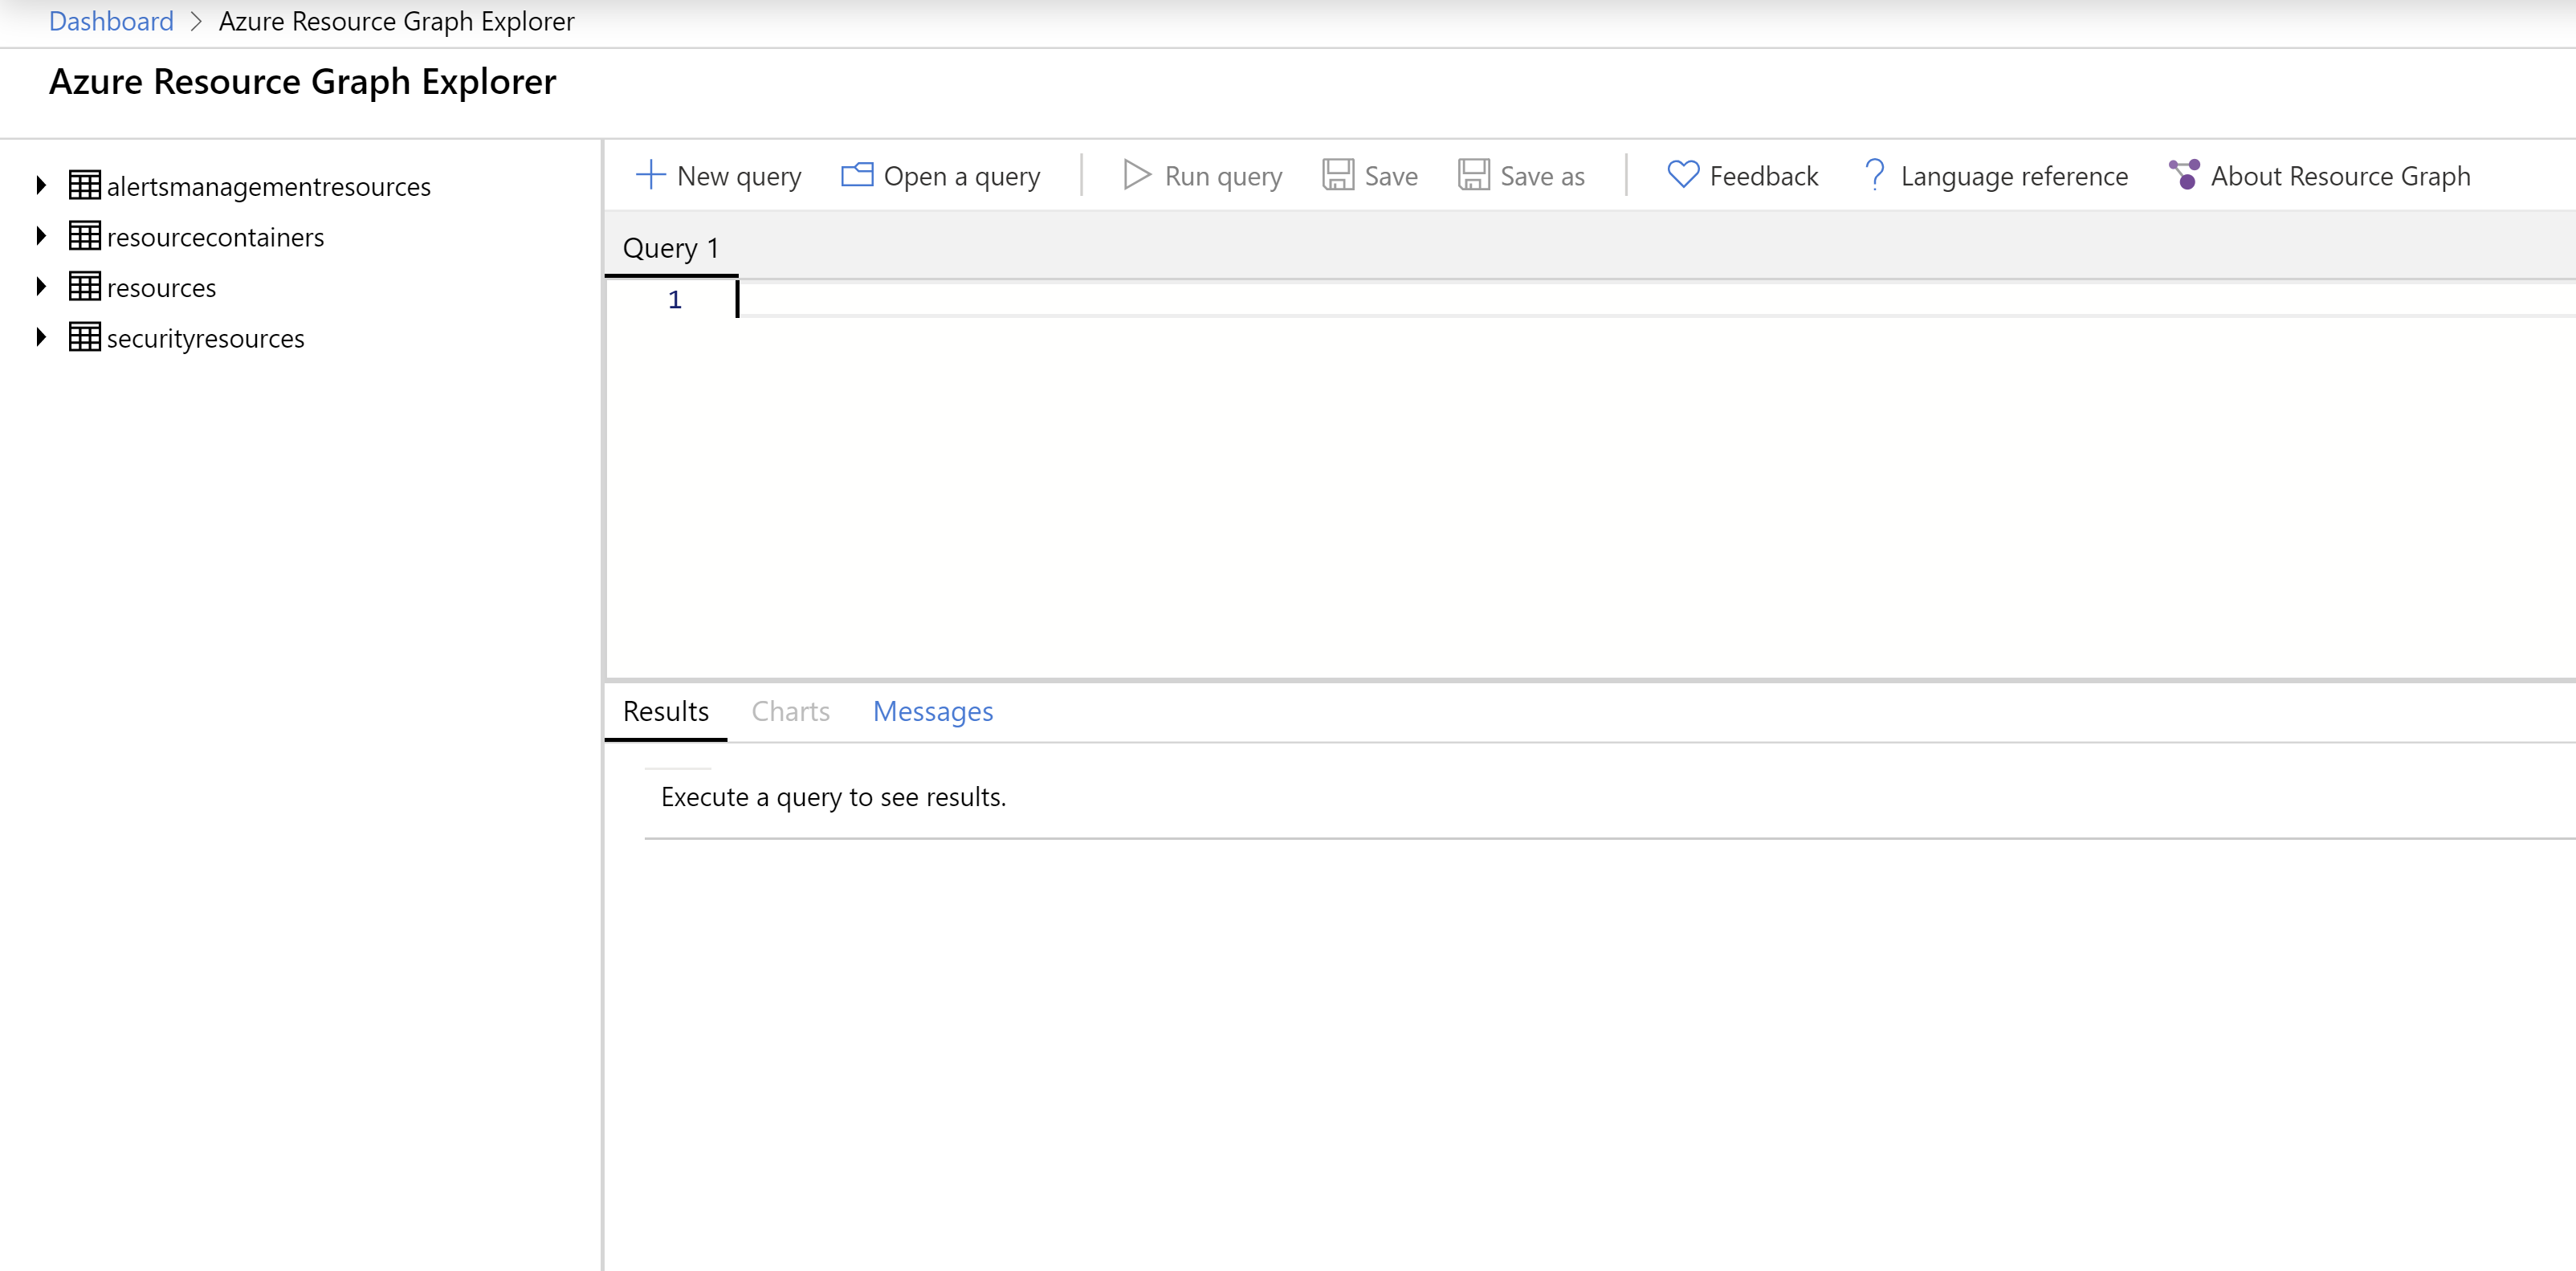
(Resource Graph Explorer in the Azure portal)
On the left side of the Resource Graph explorer, you'll find the resources panel. You can browse through it to find out which resource types and objects you can query.
Let's run some queries.
- In the query editor of Azure Resource Graph, type the following query:
count
- Click Run query to execute the query. This returns the total number of resources in Azure
- Let's make it more interesting. Change the query to the following:
summarize Count=count() by type
- Click Run query to execute the query. This returns the number of resources in Azure, grouped by type of resource
- In the results window, navigate to the Charts tab
- Click Bar Chart. This generates an interactive bar chart from the results. That was easy, wasn't it?
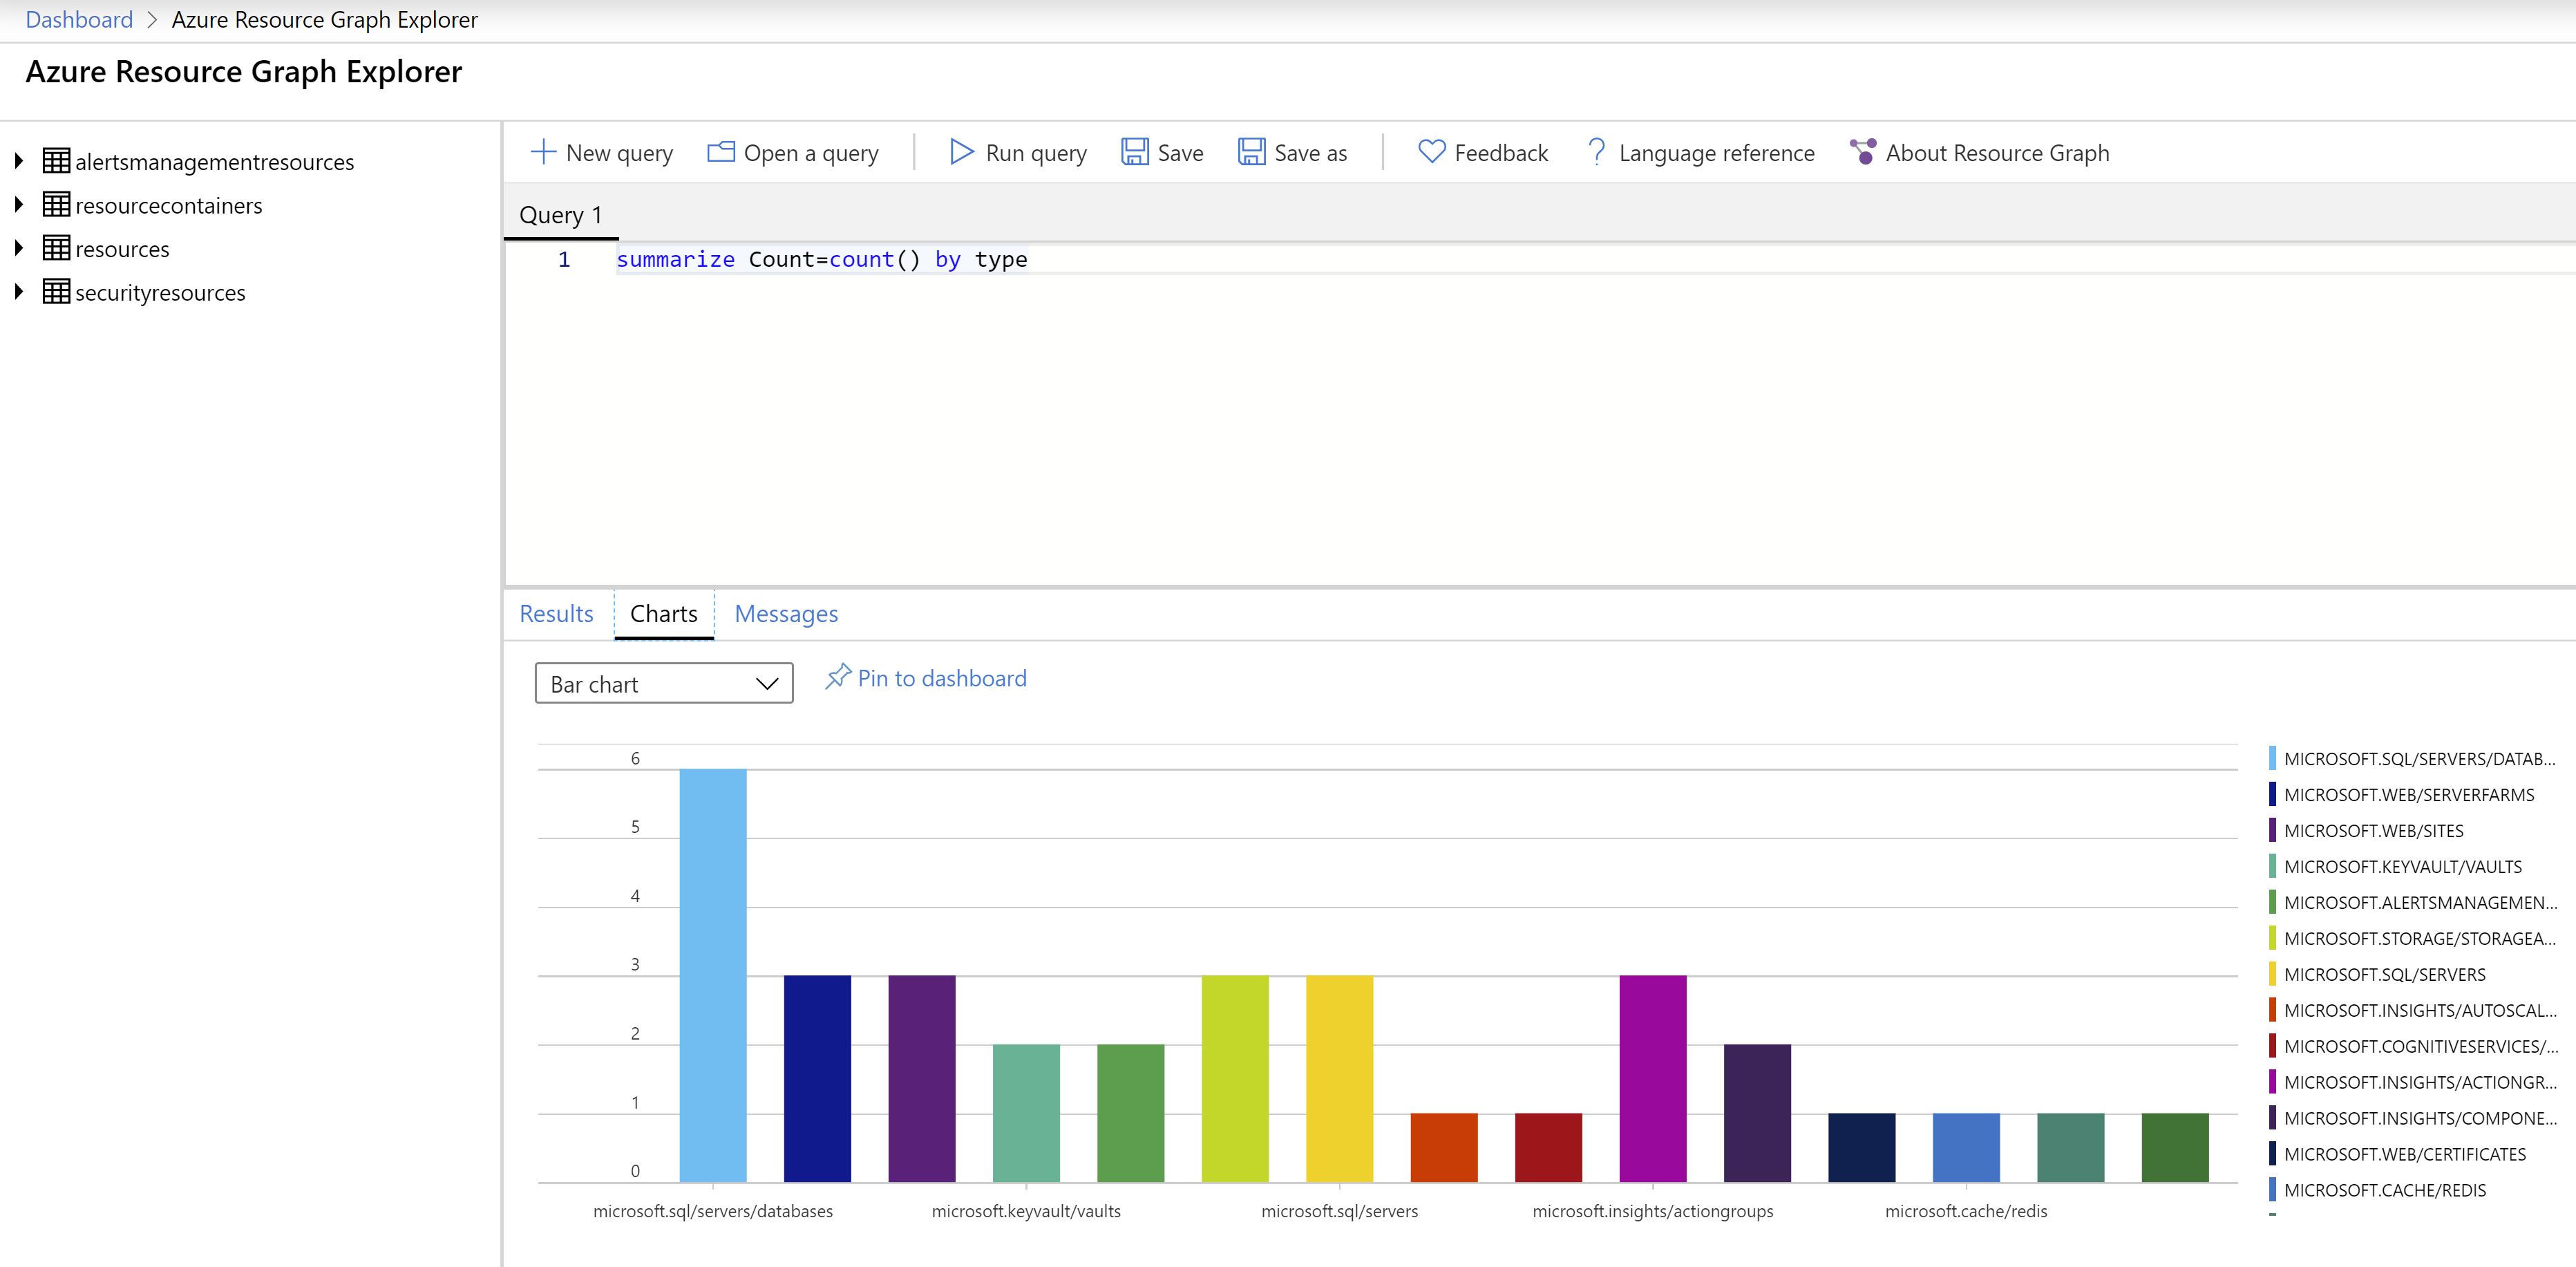
(Bar Chart in Resource Graph Explorer in the Azure portal)
- Let's expand on the query to order the results. Change the query into:
summarize Count=count() by type
| order by Count desc
2
- Click Run query to execute the query. The results are now ordered by the amount of resources
- Let's make a final change to the query to show something else:
summarize Count=count() by type, location
| order by Count desc
2
- Click Run query to execute the query. The results now show the amount of resources and their location
- In the results window, click the Pin to dashboard button, next to the Bar Chart drop-down. This pins the chart to the dashboard in the portal
- Now go to the dashboard in the Azure portal. Here, you can see the interactive chart
- There is now a new filter built into the Azure portal dashboards. This allows you to create a filter that filters the resources that you see in your Azure Resource Graph results. Create a filter for Location, that filters on a specific location in which you have resources running. This changes the chart. That is pretty cool!
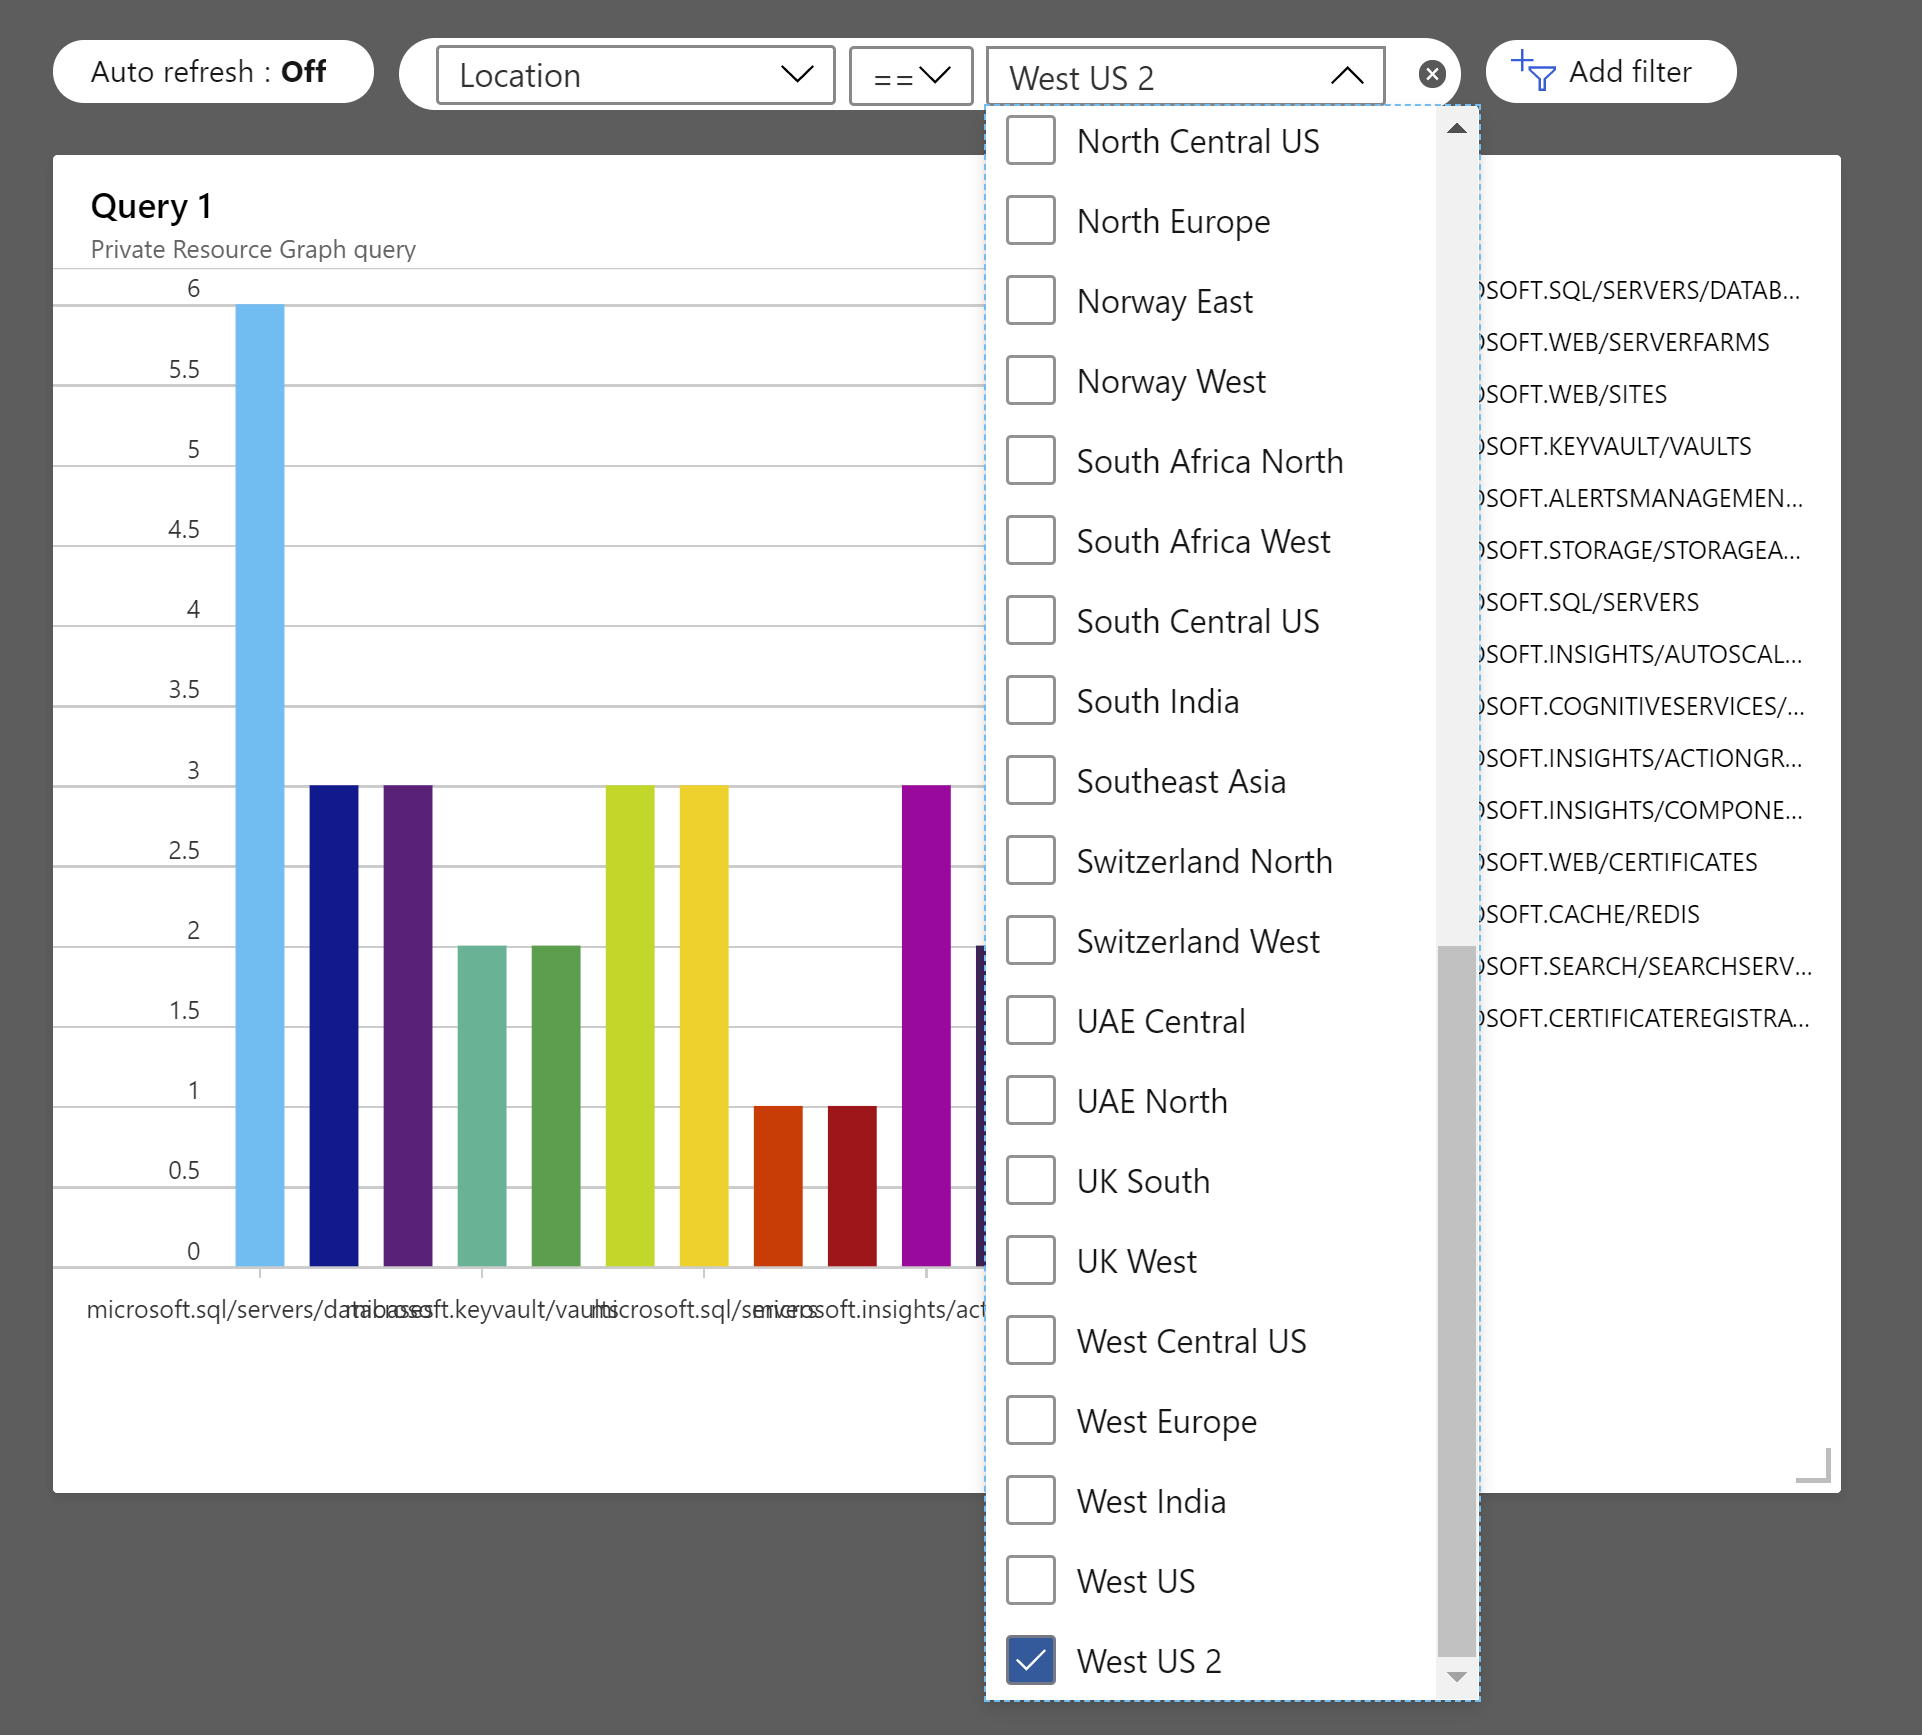
(Filter Azure Graph results in the Azure portal)
# Conclusion
Azure Resource Graph (opens new window) is a very powerful service in Azure that enables you to get insights into your resources. And now, it is a first-class citizen in the Azure portal. You can pin results to Azure portal dashboards and even create interactive charts from them, just by selecting a chart as the format of the result. And you can also create filters in your Azure portal dashboard (opens new window) that filter the results of the Resource Graph queries. This is really powerful. Go and check it out!