Task 01: Verify sensor coverage and health
Security Architecture Team
-
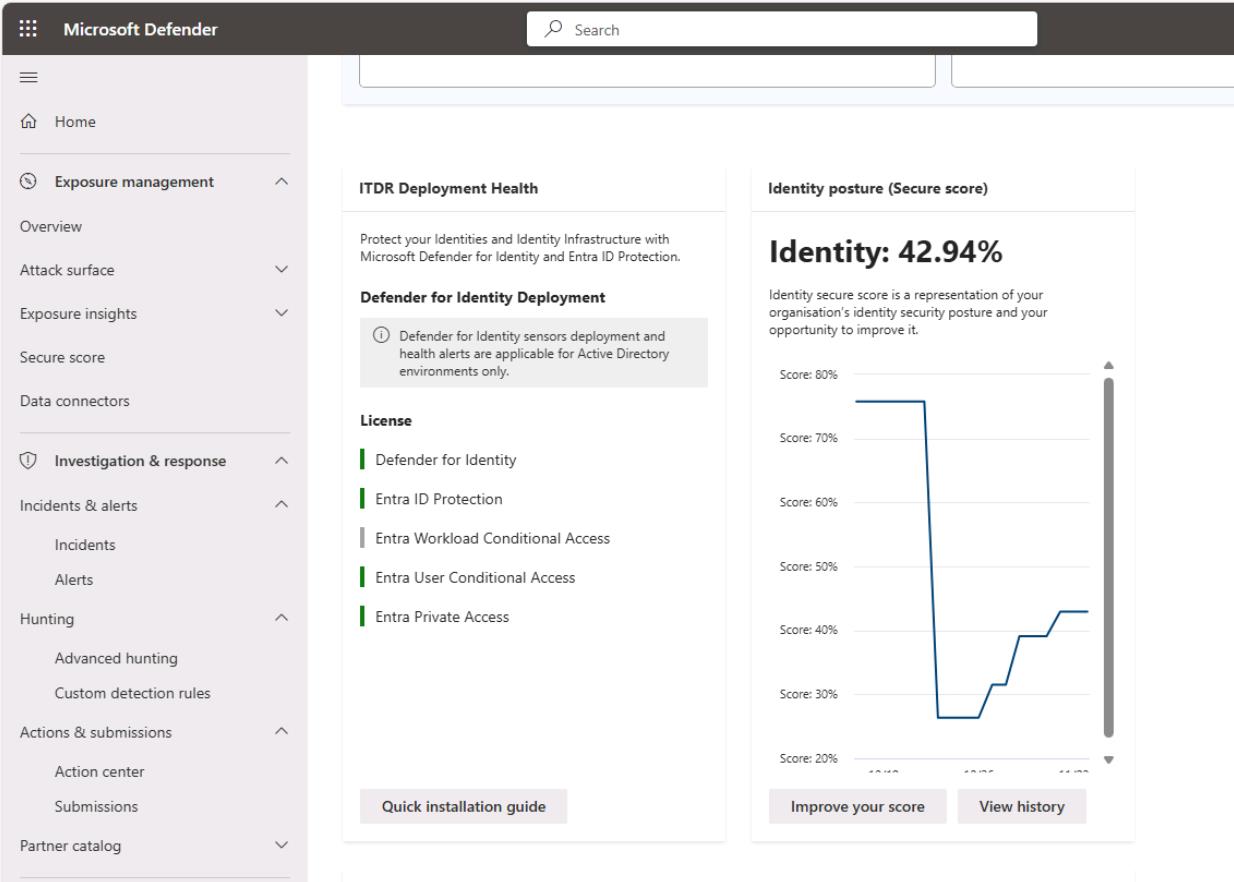
In the Defender XDR portal’s leftmost pane, go to Identities > Dashboard.
-
Review the Identity posture (Secure score) and note and screenshot the baseline score for reporting.
-
Validate the populated tiles:
- ITDR Deployment Health
- Highly privileged identities
- Active users at risk
-
DCs were not deployed in this environment. Typically, if you’ve provisioned DCs and deployed sensors, you can monitor the sensors by going to:
- In the leftmost menu, go to System > Settings.
- Select Identities.
-
You could find the following information on this page:
- DCs (Windows Server)
- Classic sensors (for example, ADFS, AD CS, Entra Connect Servers)
- Note any Unhealthy/Not reporting
- Document gaps (servers lacking sensors, unhealthy services), propose owners & ETA
Security Engineering and Administration
Optional Task: At this point, the Engineering team could check the status of the MDI sensors by running a script.
-
Open your PowerShell ISE window.
-
Run the following to change directories:
cd C:\LabFiles\E4 -
Run the following:
.\checkmdisensorservices.ps1 -DomainControllers "DC01","DC02","ADFS01","ADCS01"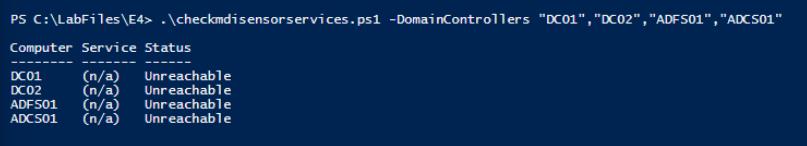
Checks each domain controller for MDI sensor and updater services, reporting reachability and service status.
Expect NotFound/Unreachable today (no DCs deployed), which is your documented gap. When you do deploy, Running is the healthy target. Service names: AATPSensor (sensor) and AATPSensorUpdater (updater).
SOC Analyst
-
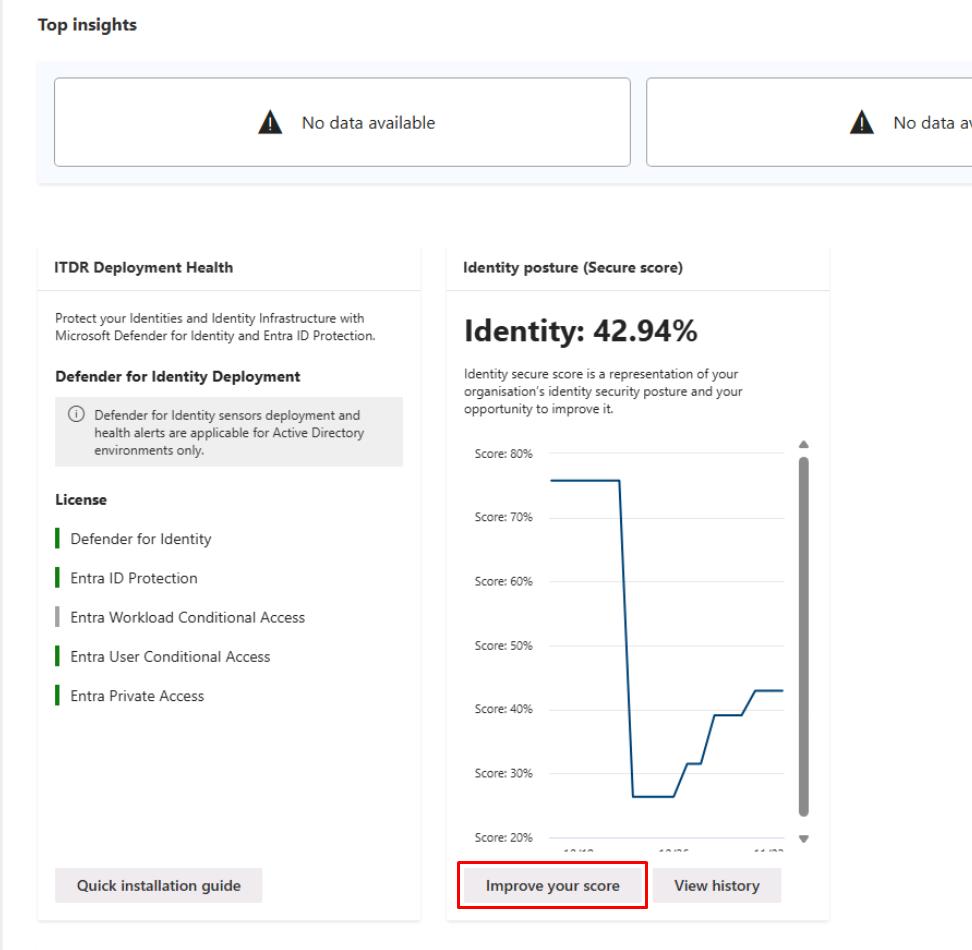
In the Defender XDR portal’s leftmost pane, go to Identities > Dashboard.
-
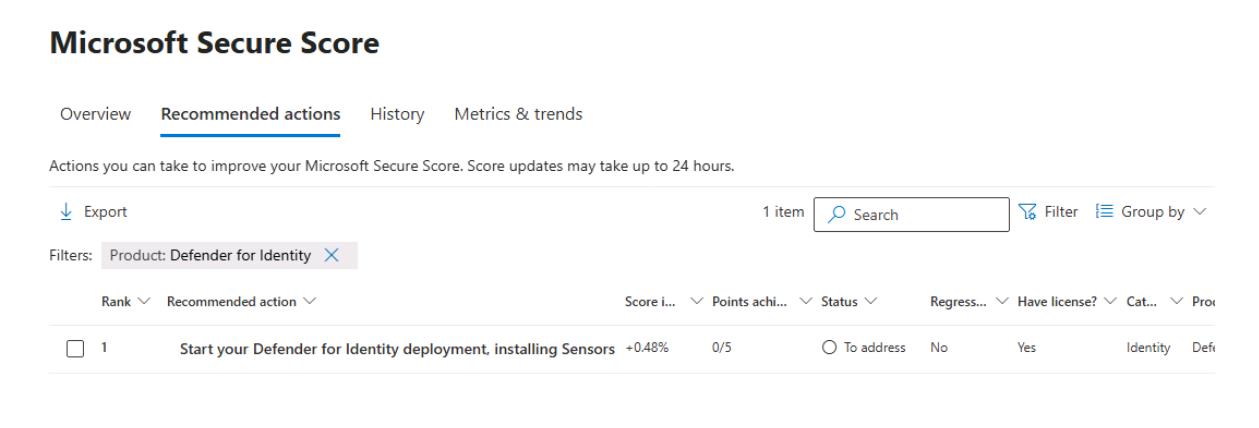
Under Identity posture (Secure score), select Improve your score.
-
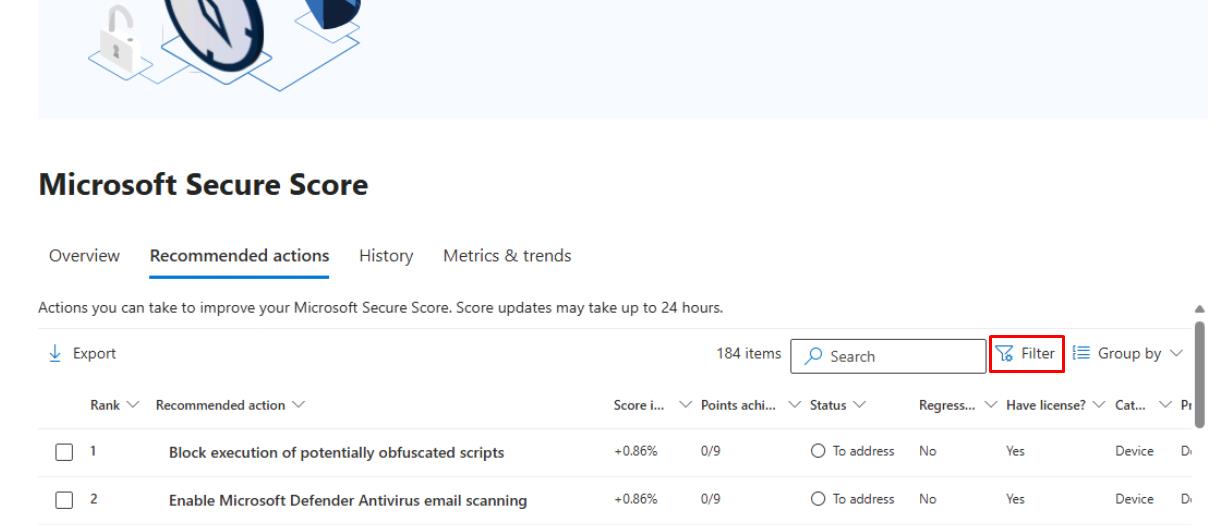
In the upper-right corner of the table, select Filter.
-
In the flyout pane, under the Product section, select Defender for Identity, then select Apply at the bottom.
-
Take a screenshot of the Recommended actions for your package.
-
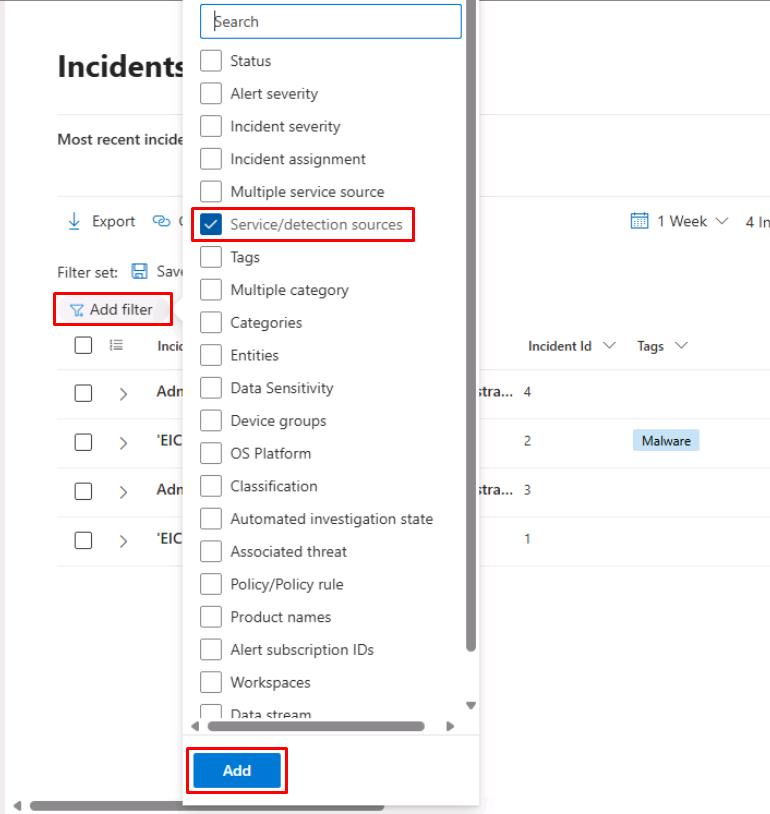
In the leftmost pane, go to Investigation & response > Incidents & alerts > Incidents.
-
At the top of the table, select Add filter, select Service/detection sources, then select Add.
-
Select the Service/detection sources filter, select Microsoft Defender for Identity filter, then select Apply.
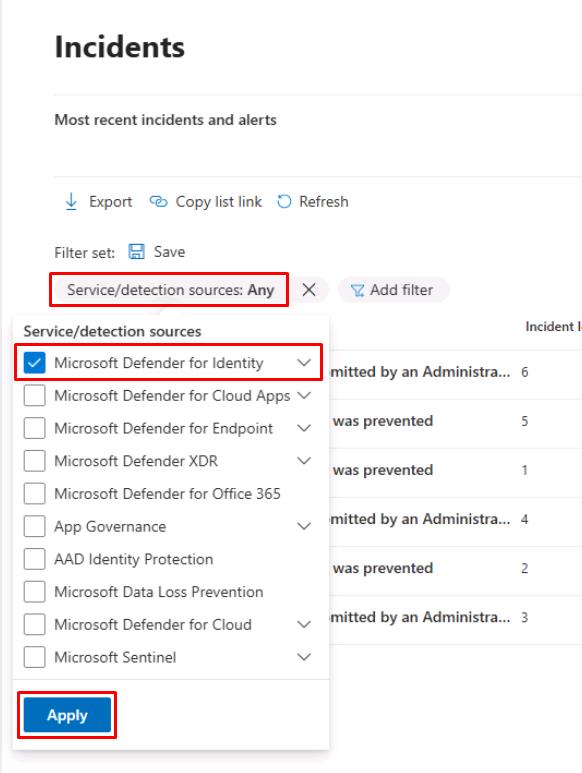
If you do not see the filter, you can proceed. If you do, you still may not see any results at the moment.
-
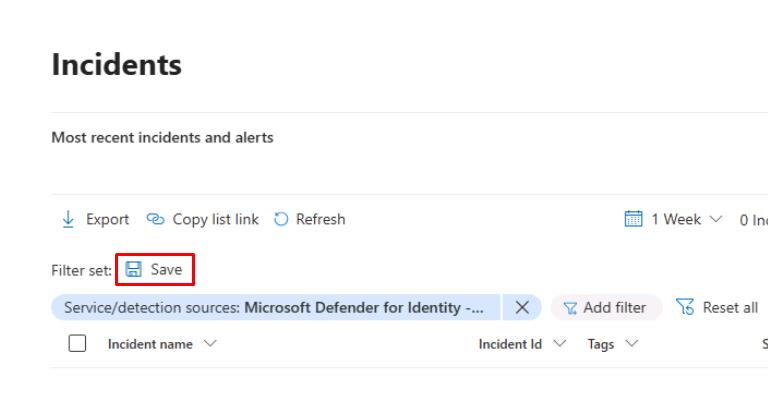
Above the table, select Save to save the filter view for later.
-
For the filter name, enter
Service/detection: Microsoft Defender for Identity, then select Save.
MDI alerts
-
In the leftmost pane, go to Investigation & response > Hunting > Advanced hunting.
-
Run the following KQL query:
 // 1) Any MDI identity alerts?
 AlertInfo
 | where ServiceSource == "Microsoft Defender for Identity"
 | summarize count() by Title
Expect zero rows until sensors exist for this and the following two queries.
-
Run the following KQL query:
// 2) Logons captured by MDI (on-prem AD + related signals) IdentityLogonEvents | summarize count() by LogonType -
Run the following KQL query:
 // 3) Directory changes seen by MDI
 IdentityDirectoryEvents
 | summarize count() by ActionType
If you see an error, the table has not been provisioned yet. You can proceed.